

 Written by Yashu Gola, Staff Writer. Reviewed by Allen Scott, Staff Editor. Written by Yashu Gola, Staff Writer. Reviewed by Allen Scott, Staff Editor.
 Three Bitcoin charts say BTC price may rally toward $82K
Market AnalysisPublishedApr 28, 2026Bitcoin’s ascending channel setup and rising stablecoin inflows suggest improving liquidity conditions could support a push toward higher price levels.

Bitcoin (BTC) has rebounded more than 28% from its February low below $60,000, and a mix of technical, liquidity, and on-chain signals suggests the recovery may still have room to run.
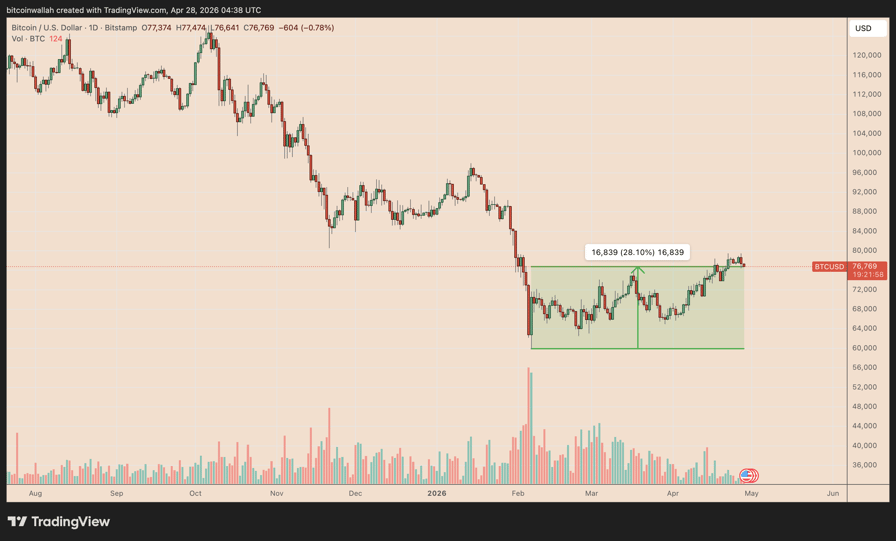
BTC/USD daily chart. Source: TradingView
Key takeaways:
- Bitcoin is holding a support zone that has previously triggered 8%–10% rebounds.
- Binance stablecoin inflows are rising, boosting fresh deployable liquidity for crypto markets.
BTC hits support with 8%–10% rebound history
Since early April, Bitcoin has been trading within a well-defined ascending channel, with price consistently respecting both rising support and resistance trend lines.
Each test of the lower boundary has triggered 8%–10% rebounds, often driving BTC back toward, or even beyond, the upper trend line. The current setup mirrors those prior cycles.
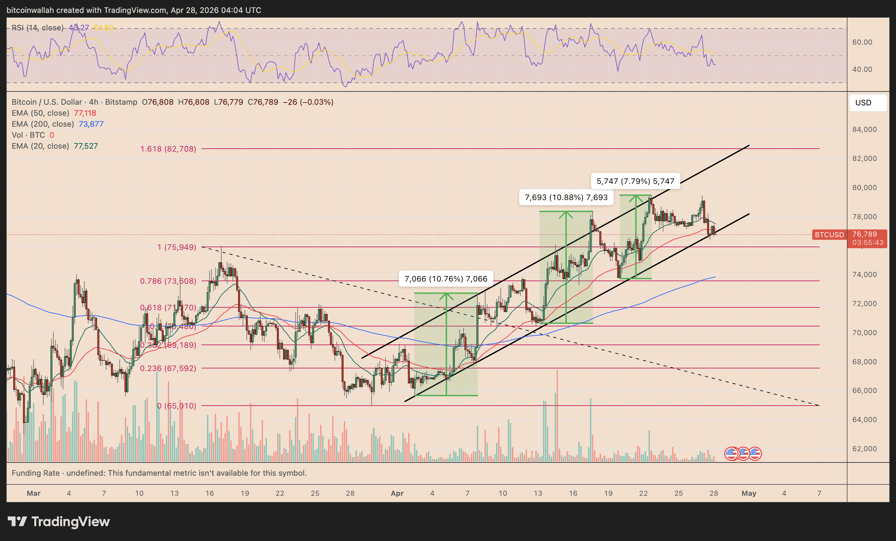
BTC/USD four-hour chart. Source: TradingView
BTC is now consolidating near the channel’s lower support zone around $76,800–$77,500, which also coincides with the 20-period (green) and 50-period EMAs (red) on the 4-hour chart, a key dynamic support level in ongoing uptrends.
A rebound from this range increase the odds of BTC’s price hitting the upper boundary near $82,700, up by roughly 7.70% from current prices. This level coincides with the 1.618 Fibonacci retracement level.
Related: Bitcoin shorts create $1.4B liquidation risk: Is a price squeeze to $80K next?
Conversely, a breakdown risks BTC price dropping toward $73,600, a level aligning with the 0.786 Fib line and the 200-4H EMA (blue).
Binance’s stablecoin inflows boost BTC rally potential
Liquidity conditions are also rising, which improves the technical setup.
Binance has recorded nearly $6 billion in stablecoin inflows across March and April, including $3.5 billion in April alone, marking a sharp reversal from the previous $7.6 billion in net outflows, data from CryptoQuant shows.
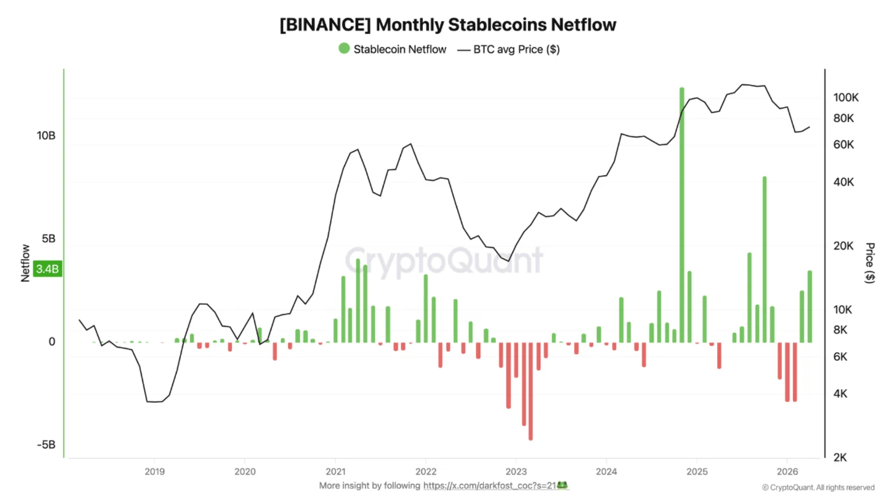
Binance monthly stablecoin netflow. Source: CryptoQuant
This is important for the bulls because stablecoin inflows represent deployable capital. In other words, liquidity is returning to exchanges, suggesting traders are preparing to re-enter risk despite US–Iran tensions and elevated oil prices.
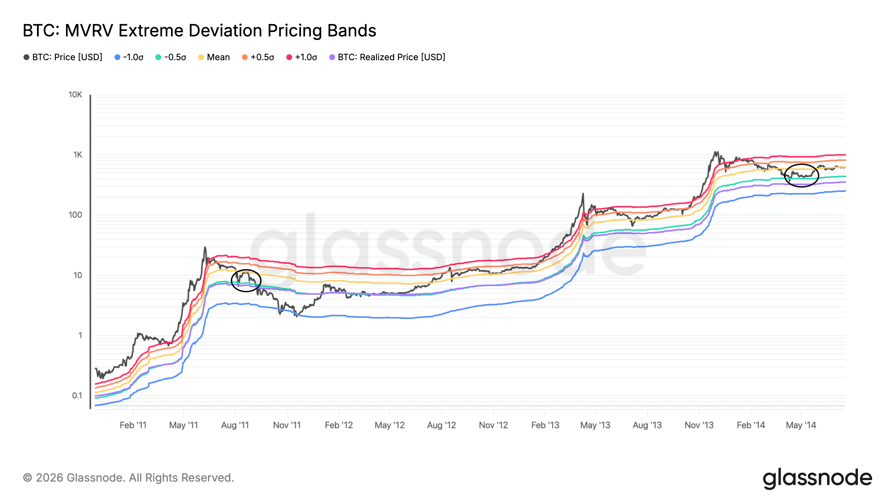
Bitcoin MVRV fractal hints at rally above $92,000
Bitcoin’s latest rebound has pushed its price back above the MVRV -0.5 standard deviation band (green) at around $72,750. This band has often acted as support and resistance across previous market cycles.
The MVRV bands measure how far Bitcoin’s spot price has moved from investors’ aggregate on-chain cost basis.
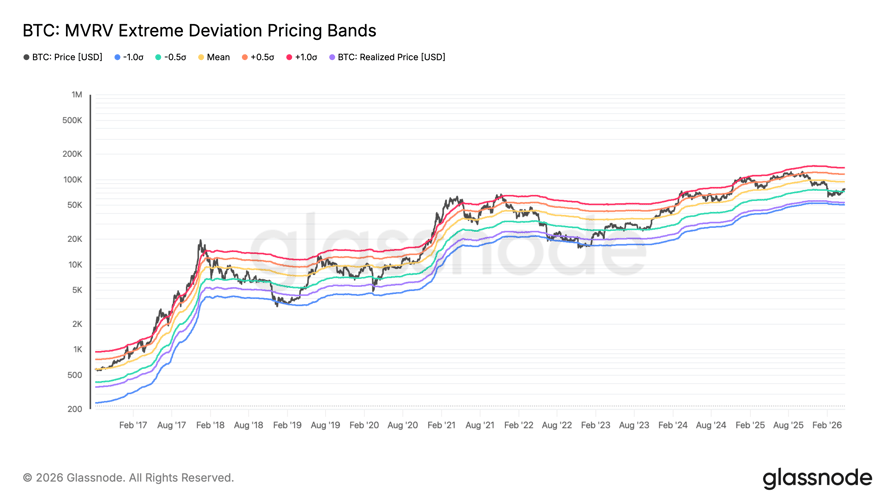
BTC MVRV Extreme Deviation Pricing Bands vs. price. Source: Glassnode
When BTC climbs back above a lower deviation band, the market is no longer trading at a deep discount to its realized value, often opening room for a move toward the next band.
A similar reclaim of the green band as support in past downturns, including the 2014 and 2018 bear markets, preceded short-term rallies toward the mean band (yellow), as shown below.
BTC MVRV Extreme Deviation Pricing Bands vs. price. Source: Glassnode
That puts Bitcoin’s next potential upside target near $94,500 if history repeats.
The signal does not confirm a new bull market, but it does strengthen the case for a bear-market relief rally. On-chain analyst Willy Woo said Bitcoin is still forming a bottom, with the $65,000 level acting as a key floor.
A decisive break above the $79,000 cost basis of recent investors is needed to strengthen the recovery, said Woo, with the next six weeks likely to determine whether the move can evolve into a sustained trend reversal.
The next test for BTC is cleanly breaking the cost basis of recent investors (79k).
I give it 30% odds on doing this on this attempt.

