Is a global 2008-style economic crash nigh? And do current conditions resemble the early stages of a broader global financial crisis driven by debt costs, inflation pressure, and constrained policy responses?
Those questions have become harder to dismiss because the pressure points are stacking in the wrong order: high sovereign yields, high public debt, an energy shock, sticky inflation, and stretched asset valuations.
The world has echoes of 2008, but the policy setting is different. Banks are better capitalized than they were before the global financial crisis, and the Federal Reserve's latest financial-stability work still points to areas of resilience in household and bank balance sheets.
Any 2020 analogy also breaks down: governments and central banks could then flood the system with support while inflation was muted.
The setup is different because the rescue tradeoff is more expensive. Global public debt stood at just under 94% of GDP in 2025 and is projected to reach 100% by 2029 in the IMF's April Fiscal Monitor.
The World Bank is warning that the Middle East war can push energy, food, fertilizer, and inflation higher. The Financial Stability Board has flagged sovereign bond markets, asset valuations, and private credit as areas that need close monitoring.
The result is a credible, reasonable worst case, with inevitability still outside the evidence.
Sovereign yields return to global financial crisis warning levels
[Editor's Note: Intraday volatility was extremely high today, May 13. Snapshot used for this article was taken around 14.00 UTC]
The bond market is where the question starts. Intraday government-bond data today, May 13, showed U.S. Treasurys at roughly 3.99%, 4.46%, and 5.03% across the 2-year, 10-year, and 30-year tenors.
U.K. gilts were around 4.53%, 5.10%, and 5.78%. German Bunds were near 2.71%, 3.11%, and 3.63%. Japanese government bonds sat at around 1.40%, 2.59%, and 3.82%.
The historical comparison is critical here. Nasdaq previously marked U.S. 2-year yields at the highest since 2007, when they reached 4%.
U.K. 2-year gilts are at the highest levels since June 2008, while U.K. 10-year yields are near 18-year highs, and 30-year gilts are near levels associated with 1998.
Germany's 10-year Bund is close to its highest level since May 2011, during the eurozone debt crisis. Japan's 10-year yield has reached levels last seen in 1997, with the 2-year yield at levels last seen in 1995.
China is the exception. Its 10-year government bond yield was around 1.74% on May 13, with the 2-year near 1.27% and the 30-year near 2.24%, according to Trading Economics.
That curve points to a different growth and price backdrop, splitting the story into high-yield stress in developed markets and low-yield growth pressure in China.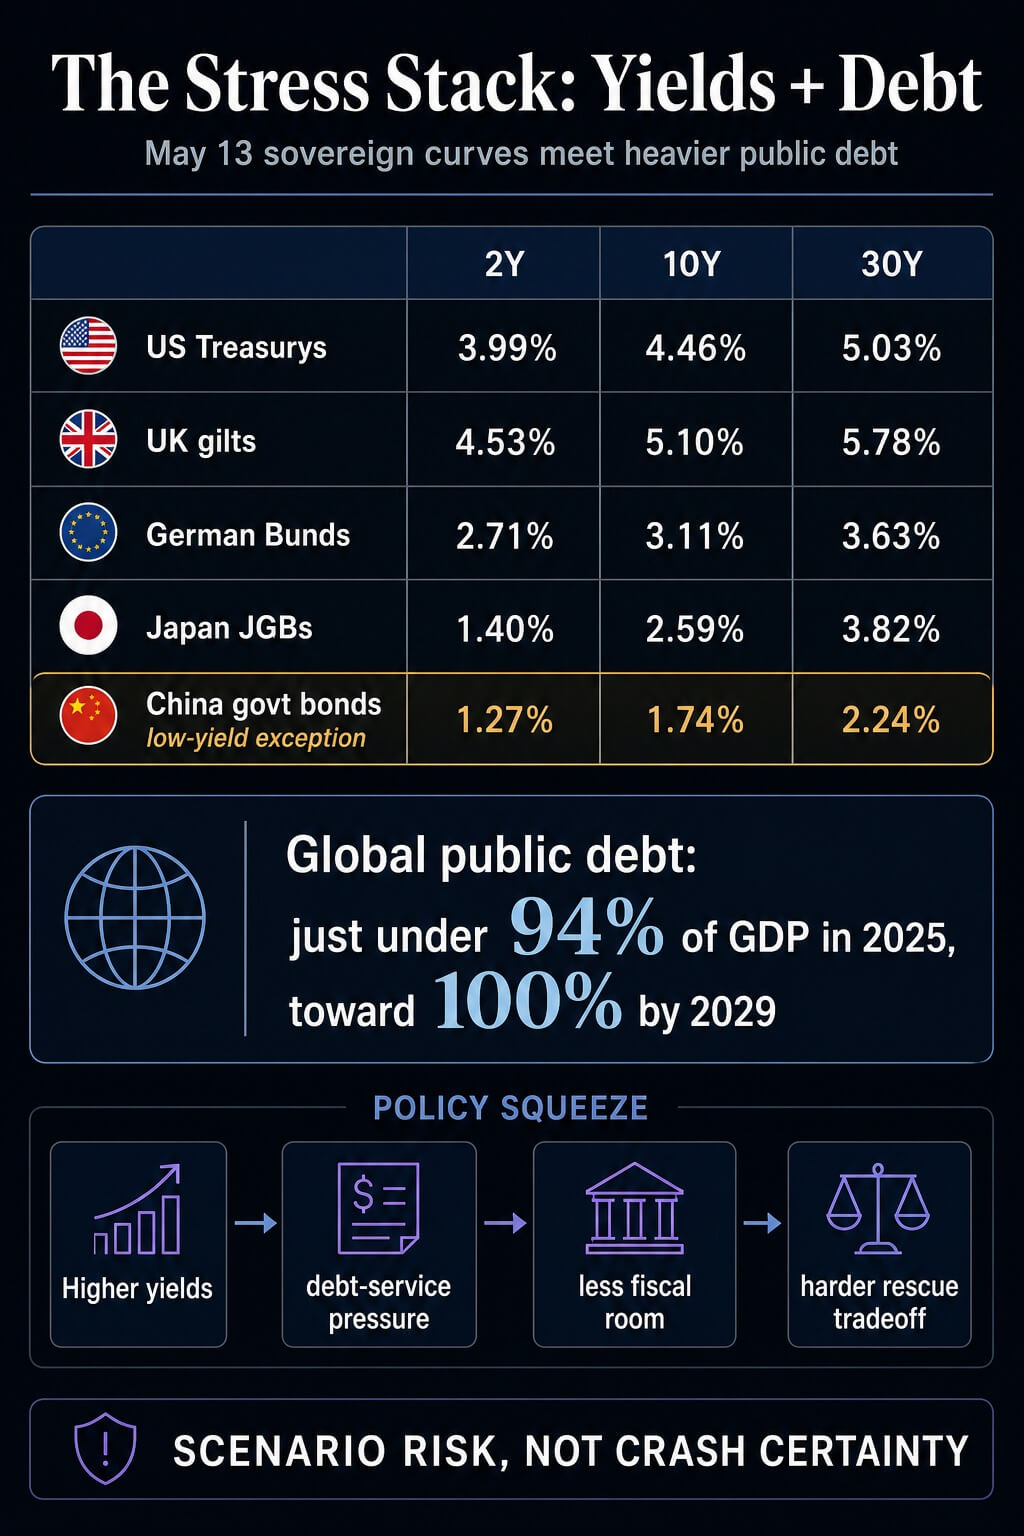
The developed-market side still carries the bigger fiscal problem. The OECD's 2026 debt work shows heavy sovereign borrowing and refinancing needs across its member economies.
Higher yields roll into auctions, coupon costs, and political choices over time. The longer the long end stays elevated, the more the market forces governments to choose between higher interest bills, reduced spending flexibility, and larger deficits.
In 2008, aggressive monetary rescue and balance-sheet support helped stabilize the financial system. In 2020, fiscal and monetary expansion bridged a sudden collapse in activity.
In 2026, the debt stock is bigger, long-end yields are higher, inflation risk is visible, and an energy shock is already inside the data.
Hormuz turns oil risk into policy risk
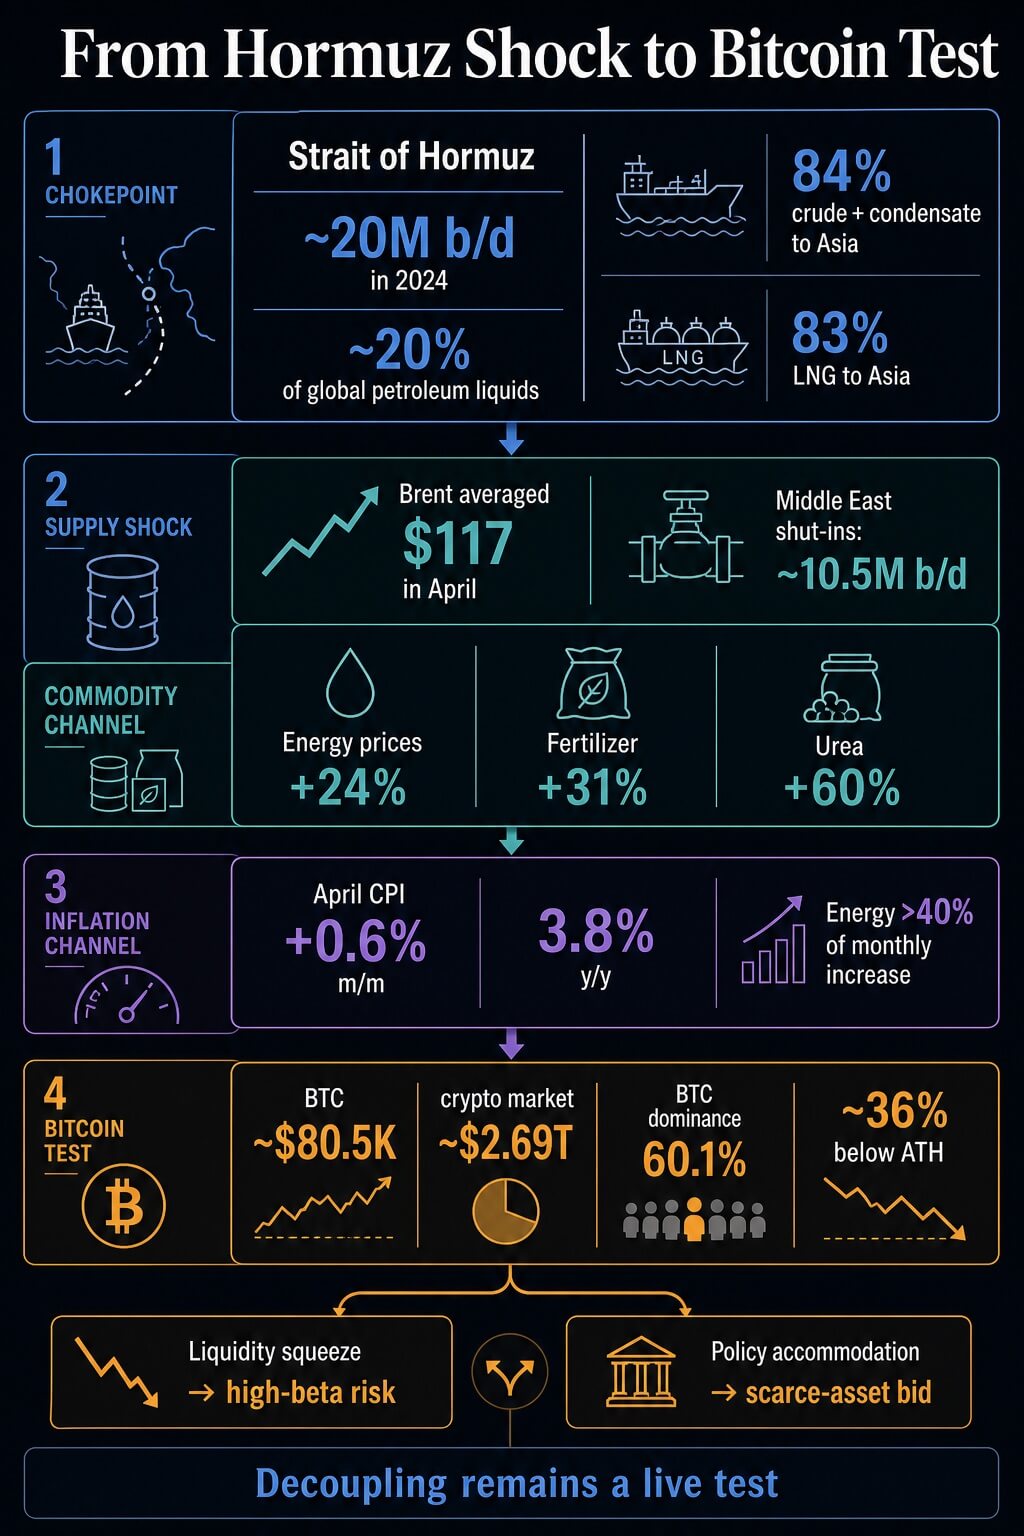
The Strait of Hormuz is the main pressure point because it turns a regional conflict into a global cost shock. The U.S. Energy Information Administration estimates that roughly 20 million barrels per day moved through the strait in 2024, equal to about 20% of global petroleum liquids consumption.
The agency also estimated that 84% of crude oil and condensate and 83% of LNG moving through Hormuz went to Asian markets that year.
The current shock has moved into official price and supply forecasts. In its May 2026 Short-Term Energy Outlook, the EIA described Hormuz as effectively closed to shipping traffic, said Brent averaged $117 per barrel in April, and assessed Middle East production shut-ins around 10.5 million barrels per day that month.
The agency assumes flows begin to resume from late May or early June, but that assumption is itself one of the live risk variables.
The World Bank's April Commodity Markets Outlook puts the macro channel in plain terms. Energy prices are projected to surge 24% this year, Brent is forecast at $86 per barrel in the baseline, and a severe-disruption scenario could push Brent as high as $115.
Fertilizer prices are projected to rise 31%, driven by a 60% jump in urea. The same report warns that higher commodity prices will lift inflation and weaken growth, especially in developing economies that already have limited fiscal buffers.
The U.S. data already show part of that pass-through. The Bureau of Labor Statistics said April CPI rose 0.6% on a seasonally adjusted monthly basis and 3.8% over the year before seasonal adjustment.
Energy accounted for more than 40% of the monthly increase.
That is the mechanism that makes the crash question credible. A shorter shock can still keep inflation expectations firm enough to slow rate cuts while debt-service costs continue to climb.
If growth weakens at the same time, the policy choice becomes ugly: defend inflation credibility or defend financial stability.
 Related Reading
Bitcoin only has one path through 2026 because massive oil price contagion just spread to 8 major economies
Hormuz-driven oil stress is forcing policy shifts across 8 economies, leaving Bitcoin stuck between liquidity squeeze and support. May 12, 2026 · Liam 'Akiba' Wright| Trigger | Transmission path | Release valve |
|---|---|---|
| Higher sovereign yields | Debt-service costs rise as governments refinance | Debt maturities stagger the impact over time |
| Hormuz disruption | Oil, LNG, fertilizer and shipping costs feed inflation | Rerouting, demand adjustment and resumed flows can soften the first shock |
| Sticky inflation | Central banks have less room to cut into market stress | Weak growth can still force accommodation later |
| High valuations and leverage | Risk assets have less margin for bad news | Bank and household balance sheets still show resilience |
| Bitcoin decoupling test | BTC either trades as scarce collateral or high-beta risk | Recent divergence is early and still needs confirmation |
Why markets have less policy support than before the global financial crisis
The equity-market tension is that risk assets can look calm even while the bond market is repricing the policy backdrop. The Fed's May Financial Stability Report said forward equity price-to-earnings ratios remained in the upper range of their historical distribution.
Corporate bond spreads were still low by longer-run standards. Hedge fund leverage remained near all-time highs and was concentrated among the largest funds.
That mix is a cushion problem. The same Fed report said market contacts most frequently cited geopolitical risks, an oil shock, private credit, and persistent inflation as salient risks to financial stability.
The FSB made a similar point in April, saying the Middle East conflict had already created a substantial global economic shock, with market reactions visible in energy prices and government bond yields.
That is the collision investors have to watch across policy meetings, auctions, and liquidity conditions. Markets can absorb high rates when growth is strong, inflation is falling, and fiscal financing looks manageable.
They can absorb oil shocks when central banks can look through the price spike. They can absorb high public debt when borrowing costs are pinned down. The current setup weakens each cushion at once.
 Related Reading
US Treasury yields spike to highest levels in a year adding new problem for Bitcoin liquidity
Bitcoin’s next move now runs through Treasury yields, oil pressure, and Fed liquidity as markets test whether risk demand can hold near resistance. Apr 30, 2026 · Liam 'Akiba' WrightA crash becomes a reasonable worst case if the sequence tightens: Hormuz keeps energy and fertilizer prices high; inflation remains sticky; central banks delay support; long-end yields stay elevated; debt-service pressure grows; risk assets that had priced a soft landing reprice toward weaker growth and tighter liquidity.
A calmer path is also possible. If oil flows normalize, inflation eases, real yields soften, and central banks can pivot toward growth support, the stress stack breaks before it becomes systemic. That framing is conditional fragility.
That distinction is critical for market timing. Sovereign stress tends to build through auctions, refinancing calendars, credit spreads, equity multiples, and central-bank decisions. It rarely announces itself through one clean trigger.
That gives markets time to adapt, but it also means pressure can keep accumulating after the first oil-price spike fades. A soft-landing trade can survive one shock; the harder test is whether it survives several at once, with each channel limiting the policy answer to the next.
Bitcoin becomes the macro test during global financial crisis fears
Bitcoin sits at the end of this chain because it is now part of the macro read.
Bitcoin traded around $80,500 on May 13, before hot PPI pushed it below $80,000, while the broader crypto market stood at around $2.69 trillion, and BTC dominance held at around 60.1%.
That leaves it still large enough to be a macro asset, while its volatility keeps it outside clean-shelter status.
Recent CryptoSlate coverage has noted windows when Bitcoin moved differently from U.S. equities amid oil, yield, and dollar pressure on stocks. Another CryptoSlate analysis framed the Hormuz shock as a fork for Bitcoin: either a liquidity squeeze that drags BTC back into high-beta collateral behavior, or a policy-accommodation path that revives the scarce-asset trade.
 Related Reading
Bitcoin decouples from S&P 500 as oil, yields, and dollar pressure stocks
BTC’s break from stocks now depends on whether buyers can absorb oil, yield, and dollar pressure at the same time. May 5, 2026 · Liam 'Akiba' WrightThat is the sober way to treat Bitcoin here. Bitcoin's record as a stable inflation hedge remains unproven. Its separation from risk appetite remains incomplete.
Glassnode's latest market pulse supports caution: improving structure still needs confirmation amid macro pressure from rates, oil, and liquidity.
A single bad equity session tells little. The test is whether Bitcoin can hold up if stocks sell off, yields stay high, the dollar firms, and central banks hesitate to ease because inflation is still being fed by energy and food costs.
If BTC holds that environment, the monetary-disorder narrative gets stronger. If it fails, the market will have treated it as another risk asset with better branding.
That leaves the crash question with a practical answer. A 2008 replay remains an outside possibility, and the claim of inevitability is too strong.
However, the current setup is more fragile because the public debt load is heavier, the inflation shock is real, and the policy response is more constrained.
One price chart will tell only part of the story; the policy choice will carry the bigger signal. If central banks prioritize inflation control while oil and debt-service costs keep rising, financial markets will face greater stress without a rescue.
If they shift toward financial stability, Bitcoin faces its clearest test as a hedge against policy accommodation and currency-credibility risk.
Either way, the question has moved from alarmism to risk management. What pulls it back from the brink is that several release valves still exist:
- The shock is conditional. If Hormuz flows resume and oil normalizes, the inflation impulse weakens.
- Debt stress rolls through time. Refinancing calendars stagger the hit rather than forcing one immediate rupture.
- Balance sheets are stronger than 2008. The piece cites resilience in banks and households, which limits direct GFC-style contagion.
- Central banks still have optionality. They are constrained by inflation, but weak growth or market stress can still force accommodation later.
- Markets have warning indicators. Auctions, long-end yields, credit spreads, liquidity, equity multiples, and BTC’s behavior give a sequence to monitor.
The post Global financial crisis fears grow as bond yields hit 1998 levels and Bitcoin drops below $80,000 appeared first on CryptoSlate.