Elliott Wave Theory: Bitcoin and Ethereum Guide
 Charles V. — The Chart Whisperer7 min read·Just now
--
Elliott Wave Theory for Bitcoin and Ethereum: What the Charts Are Actually Telling You
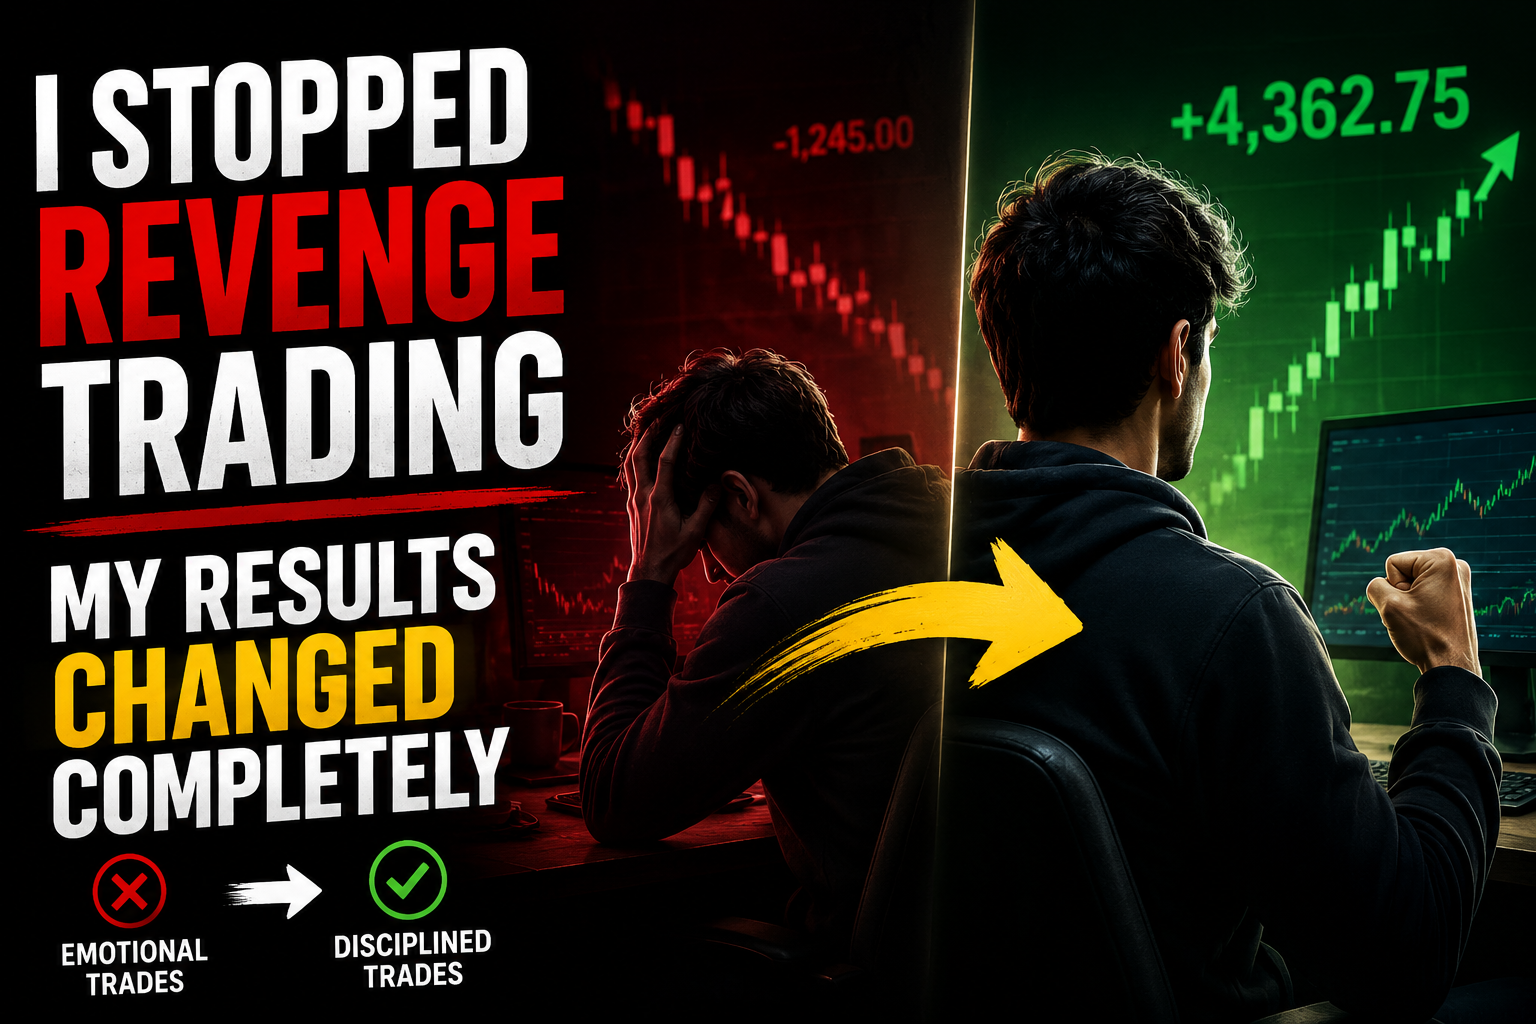
Most traders learn Elliott Wave Theory and immediately start seeing what they want to see. A bull wants five waves up. A bear wants five waves down. The chart becomes a mirror for their bias, not a map of the market.
That is not Elliott Wave. That is wishful thinking with extra steps.
Ralph Nelson Elliott built something different. He observed that markets do not move randomly. They move in structured sequences driven by the collective psychology of every participant simultaneously processing fear, greed, and uncertainty. The patterns he identified in the 1930s still appear on a Bitcoin daily chart today because human nature has not changed. Only the asset has.
This guide is for traders who want to use Elliott Wave the way it was intended: as a structural framework that defines where you are in the market cycle, what is probable from this point, and where your thesis breaks. Not a crystal ball. A map with clearly marked exits.
The Core Structure: Why Five Waves Work
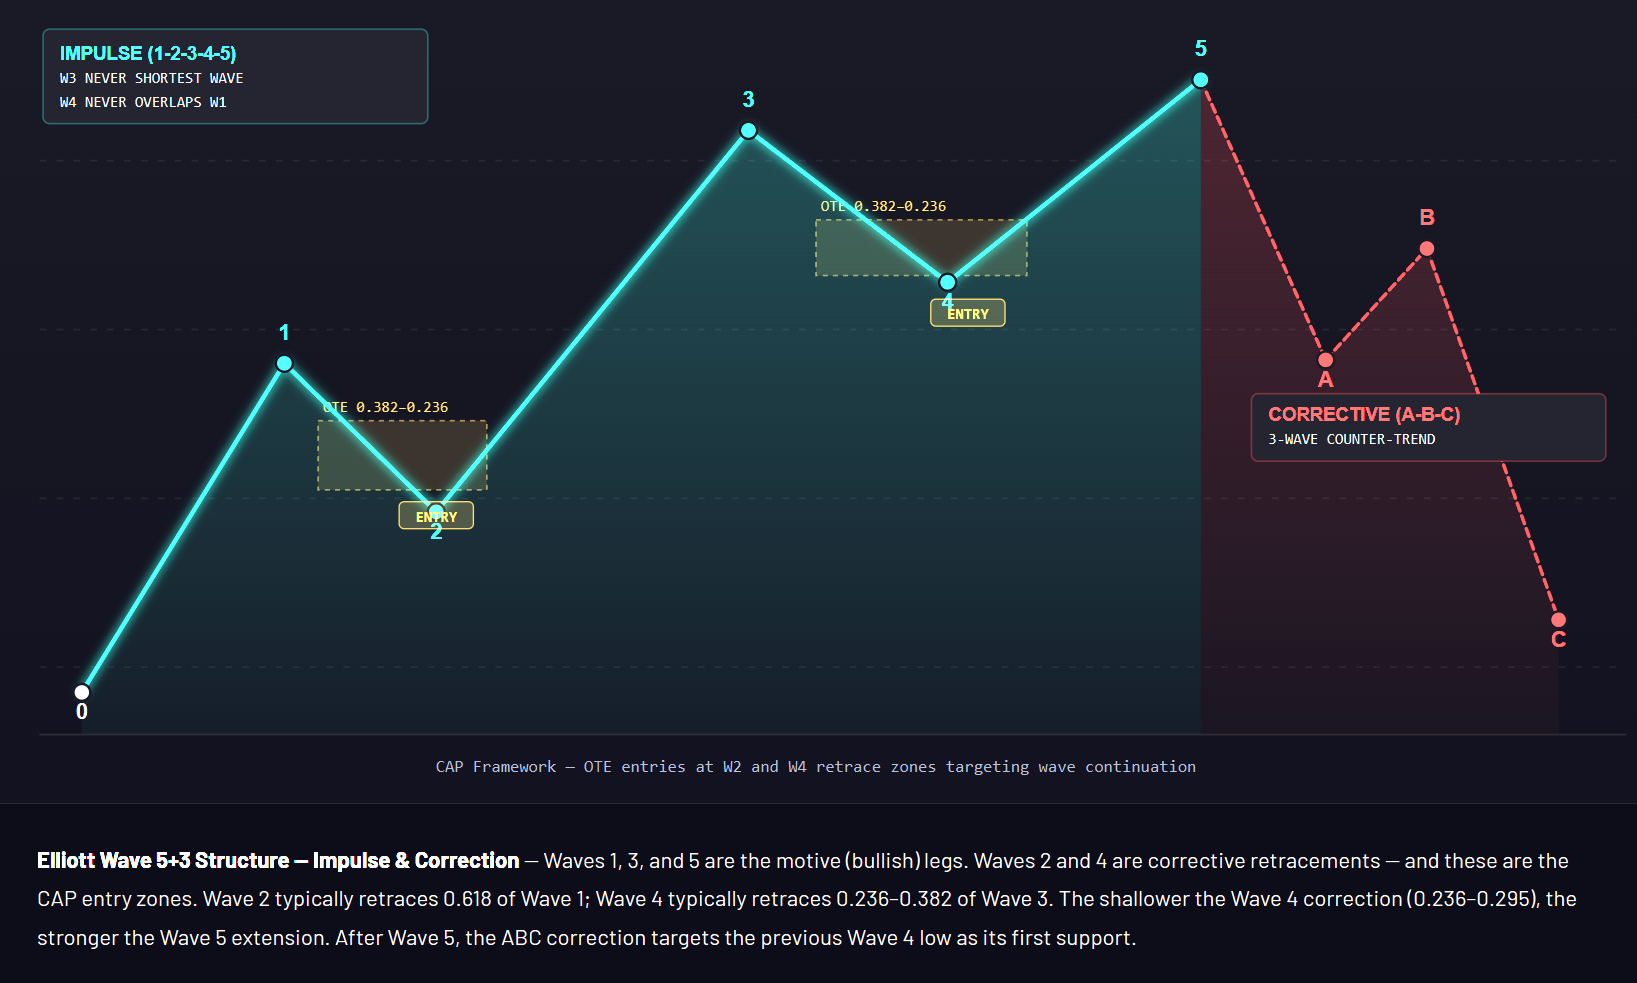
Elliott Wave Theory is built on two phases that repeat at every timeframe.
The motive phase unfolds in five waves. Waves 1, 3, and 5 move in the direction of the primary trend. Waves 2 and 4 are corrective pullbacks within that trend. The corrective phase that follows unfolds in three waves, labeled A, B, and C, moving against the primary trend before the cycle begins again.
The reason this structure repeats is not mystical. It is behavioral.
Wave 1 begins when a small group of informed participants recognizes value the crowd has not yet priced in. Volume is modest. Conviction is quiet. Wave 2 shakes most of them out. The retracement is deep enough to feel like the original thesis was wrong. Most who bought Wave 1 sell in Wave 2.
Wave 3 is where the thesis becomes visible to the broader market. Volume expands. Momentum accelerates. This is the wave that produces the largest percentage move and the highest-conviction entries. Wave 3 is never the shortest wave. When you see a market that just broke structure explosively with expanding volume and minimal retracement, you are likely inside Wave 3.
Wave 4 consolidates the gains. It is shallower than Wave 2, typically correcting in time rather than price. The crowd, now aware of the trend, uses the pullback to add exposure. Wave 5 is the final push, often accompanied by peak sentiment, declining volume relative to Wave 3, and divergences on momentum indicators. When everyone agrees the trend is obvious, Wave 5 is already distributing.
The corrective ABC sequence that follows unwinds the entire move. Wave A breaks the structure. Wave B creates a false sense of recovery. Wave C completes the correction and sets the stage for the next motive sequence.
Why Most Traders Get Elliott Wave Wrong
The most common failure mode is subjectivity. Elliott Wave allows for enough interpretation that any count can be justified in hindsight. Traders who approach it without hard rules end up counting backward from the outcome they want.
The second failure mode is isolation. Elliott Wave applied without context from volume, order flow, or market structure is incomplete. You can identify a perfect five-wave count on a four-hour BTC chart and still lose money if you are entering against institutional accumulation or in the wrong Wyckoff phase.
The third failure mode is timeframe confusion. Elliott Wave is fractal. The same five-three pattern that appears on a monthly chart also appears on a fifteen-minute chart, nested inside the larger structure. Traders who only count one timeframe miss the structural context that determines whether a Wave 2 pullback is a buying opportunity or a precursor to a larger corrective sequence.
The fix for all three is integration. Elliott Wave becomes precise when it is used alongside Wyckoff phase analysis to confirm the macro regime, structural analysis to confirm directional bias at the trade timeframe, and volume-based tools like CVD to confirm whether the move has real participation behind it.
How This Applies to Bitcoin
Bitcoin is one of the most reliable markets for Elliott Wave analysis precisely because of its volatility and the emotional nature of its participant base. Institutional positioning creates the structural skeleton. Retail emotion fills in the waves.
The major BTC cycles have followed Elliott Wave structure with remarkable consistency. The 2020 to 2021 bull run traced a classic five-wave impulse from the COVID lows. Wave 3 was the explosive move from roughly $10,000 to $58,000. Wave 4 corrected in the flat consolidation that most participants experienced as a death by a thousand cuts. Wave 5 completed at the November 2021 high with classic exhaustion characteristics: new price highs, declining relative volume, and negative momentum divergence on the weekly.
What followed was not random. It was a textbook corrective sequence.
For active traders, the practical application is not in predicting macro targets. It is in identifying your position within the structure so you can frame trade opportunities with appropriate context. A Wave 2 pullback in a confirmed uptrend is a high-probability long setup. An ending diagonal completing Wave 5 is a high-probability mean-reversion short. Knowing where you are changes the risk/reward profile of every entry you take.
At chartwhisperer.ca, Gate 1 of the CAP Framework is specifically dedicated to this identification. Before any trade is considered, the macro wave position must be established. Entering a Wave 3 long with full size carries a completely different expectation profile than fading a Wave 5 exhaustion pattern. Treating them the same is how traders give back months of gains in a single trade.
How This Applies to Ethereum
Ethereum follows BTC’s macro wave structure but with its own character. ETH tends to amplify the moves. Wave 3s run further. Corrective sequences are deeper. The same five-wave framework applies but with the understanding that ETH’s participant base is more reactive, making its patterns sharper and its invalidations faster.
This amplification makes ETH particularly useful for reading the broader crypto market psychology. When ETH begins leading BTC to the upside, it often signals that the market is in a late-stage Wave 3 or early Wave 5, where capital rotates into higher-beta assets. When ETH begins underperforming BTC on a strong BTC move, it frequently signals late-cycle distribution.
Practical ETH trade setups inside Elliott Wave structure concentrate on CHoCH confirmations at the end of corrective sequences and Method B entries on Wave 3 continuation structures. The CAP Framework builds these trigger conditions into Gate 2 and Gate 3 specifically to ensure that structural context from Elliott Wave is confirmed by break-of-structure signals and optimal trade entry zones before any position is opened.
The full breakdown of how these gates integrate is documented at chartwhisperer.ca/blog/elliott-wave-theory-bitcoin-ethereum-guide.
The Three Rules That Cannot Be Broken
Elliott Wave is flexible in many ways but absolute in three.
Wave 2 can never retrace more than 100 percent of Wave 1. If the move you labeled Wave 1 gets fully retraced before a new high, your count is wrong. Go back to the higher timeframe and find the correct starting point.
Wave 3 can never be the shortest motive wave. If Wave 3 is shorter than both Wave 1 and Wave 5, the structure is not an impulse. It is something else. Re-examine the degree of the wave you are counting.
Wave 4 can never overlap with Wave 1 price territory. If price enters the Wave 1 high during what you labeled Wave 4, the structure has invalidated. The only exception is in a diagonal pattern, which carries its own rules and implications.
These three rules are your built-in stop loss on your wave count. Every count that violates any of them is wrong, regardless of how clean it looked before the violation. This is where most traders hesitate because admitting the count is wrong means admitting uncertainty. But uncertainty is not a problem to be solved. It is the condition under which all professional trading occurs.
Mark Douglas understood this better than almost anyone. The goal is not certainty. The goal is a framework that gives you a structural edge across a large sample of trades. Elliott Wave, applied with discipline, does exactly that.
Integrating Elliott Wave With Institutional Order Flow
Structure without confirmation is just a hypothesis.
The highest-probability Elliott Wave setups occur when the structural count aligns with institutional order flow evidence. A Wave 2 pullback that holds an institutional order block and shows CVD accumulation at the low is a structurally sound setup with institutional confirmation behind it. A Wave 5 exhaustion that coincides with a turtle soup pattern above a key high, with CVD diverging from price, is a high-probability mean reversion trade with multiple independent reasons to act.
This is the integration that the CAP Framework formalizes across five sequential gates. Elliott Wave provides the context. Wyckoff confirms the macro phase. Break of structure confirms directional intent. OTE and order blocks identify the entry precision. CVD confirms that institutional participation is aligned with the direction of the trade.
No single tool makes the trade. The confluence makes the trade.
This is also why the CAP Framework’s documented 4.6R average risk/reward exists. The setups with the highest grades are the ones where Elliott Wave position, Wyckoff regime, structural confirmation, and order flow all point in the same direction simultaneously. Those setups are not frequent. But they do not need to be.
What This Changes About Your Trading
Understanding Elliott Wave at this level changes how you read every chart you look at.
You stop asking what the price is. You start asking where the price is within a structure. Those are completely different questions with completely different trade implications.
A trader who knows they are inside Wave 3 of a confirmed impulse structure on the daily, with Wyckoff in the markup phase and CVD confirming buy-side control, holds their position through the noise. A trader without that context gets shaken out of a winning trade by every corrective candle.
Patience becomes structural. Not psychological willpower. Structural. You hold because the structure tells you to hold, not because you hope the market comes back.
This is the discipline Elliott Wave builds when it is used correctly. Not a system for predicting the future with certainty. A framework for understanding where you are, what is probable from here, and what would need to happen to tell you that you are wrong.
That clarity is worth more than any signal.
The full CAP Framework, including how Elliott Wave integrates across all five gates, is documented at chartwhisperer.ca/elliott-wave