I run R&D at a startup where most of our development leans on AI-assisted dev tooling. After a frustrating few weeks, I went looking for an answer to a question I now realize I was asking wrong.
A few weeks ago I had one of those stretches where Claude Code — which a lot of my engineering team leans on day to day — kept dropping out just often enough to be annoying. Nothing catastrophic. But enough times in a single week that several of my engineers temporarily switched to alternative AI tooling while waiting for the green check to come back on Anthropic’s status page.
In isolation I would have shrugged it off. We’re a heavy adopter of AI tools across the R&D org — most of our day-to-day development now leans on AI-assisted dev tooling — and a small amount of upstream flakiness comes with the territory. What pulled my attention was that I was watching a separate, parallel trend at the same time: my own product’s incident count was creeping up too. Not dramatically. But noticeably enough that I’d started privately asking myself whether my team was getting a little careless.
So when curiosity finally got the better of me and I sat down to look into what was going on at Anthropic, the question I was actually carrying was bigger than them. It was something like: is the whole AI-adopter category getting sloppy this year, and is my own org part of that story?
I went looking for data. The investigation took me somewhere I didn’t expect, and the answer I ended up with isn’t the one I’d have bet on.
The obvious place to start
The cleanest entry point was Anthropic’s public status page. They publish every incident, dated, in an archive that goes back years. Anthropic is one of our larger dependencies, and they were the immediate trigger for my curiosity, so they were where my finger was already pointed.
Here’s their incident count for the four-month window of January 1 through April 25, this year compared to last year:
- 2025: 89 incidents.
- 2026: 174 incidents.
That’s a 96% year-over-year increase. Nearly double.
If you stop reading here, the headline writes itself: Anthropic doubled its production incidents. And the natural follow-up is the one my mildly-frustrated brain had already drafted: yes, they’re getting careless.
That was my working hypothesis at this point. I went looking for evidence to confirm it.
A sanity check on the rest of the AI-heavy crowd
Before drawing a conclusion about Anthropic specifically, I wanted to make sure I wasn’t fooling myself. If every SaaS company that had publicly bet on AI was logging twice as many incidents as the year before, “Anthropic is being careless” was probably the wrong frame — something more industry-wide would be at play.
So I pulled the same window from four other SaaS companies that have made big, named bets on AI coding tools internally: GitHub, Notion, Duolingo, and monday.com. Same four months, same methodology — counting the incident archive entry by entry.

The pattern was not uniform. At all.
- Anthropic: 89 → 174 (+96%)
- GitHub: 67 → 117 (+75%)
- Notion: 24 → 29 (+21%)
- Duolingo: 16 → 18 (+13%)
- monday.com: 30 → 22 (−27%)
Most of the cohort barely moved. monday.com actually got more reliable. The reliability hit is concentrated at the top of the list — the two companies whose primary business is selling AI capabilities to other developers, not just using AI tools internally.
That was the first piece of news that didn’t fit my opening narrative. If “heavy AI adoption” were the underlying cause, I’d expect Notion (very public about how much its engineers use AI coding tools) and Duolingo (same) to also be near the top. They weren’t. And — relevant to the question I was privately asking about my own team — these are companies whose engineering profile looks a lot more like ours than Anthropic’s does. They consume AI tooling rather than serving it at scale, and they’re not blowing up year over year.
So at least one read on my own situation softened a little. Whatever was happening to AI providers was concentrated at AI providers. It wasn’t a generic carelessness signal affecting everyone who’d adopted AI tooling internally.
Which made the sharper question: is what’s happening at Anthropic specifically, then, carelessness?
Two ways to double an incident count
Before going back to the data with that narrower question, I had to be honest with myself about what “carelessness” actually means in metrics. Because the incident counter alone can’t see it.
There are two distinct ways a software company can double its incident count in a single year, and they look identical from outside.
The first is that you ship the same number of changes you did last year, but each one breaks more often than it used to. Code reviews aren’t catching what they used to. Test coverage hasn’t kept up with the surface area. On-call is being asked to ship under pressure. The quality bar is sliding. That’s carelessness.
The second is that you ship roughly twice as many changes as last year, and each one breaks at exactly the same rate it always did. Nothing about quality has changed. There’s just more surface area now, and so there are more places where reality can disagree with your tests. That’s velocity.
Both produce a +96% in the headline. Both are indistinguishable if you only stare at the incident counter.
The fixes for them are completely different, though. If it’s carelessness, you fix it culturally — tighter reviews, more pairing, slower merges on the riskiest paths, raised canary thresholds. Process work. If it’s velocity, none of that helps, because the failure isn’t in how you ship; it’s in how much you ship. The interventions for a velocity-shaped problem are structural — narrower blast radius per service, fewer interlocked components, more graceful degradation. Different toolbox entirely.
So now my question had a testable shape. Which of those two shapes does Anthropic’s data actually fit?
What the changelog says
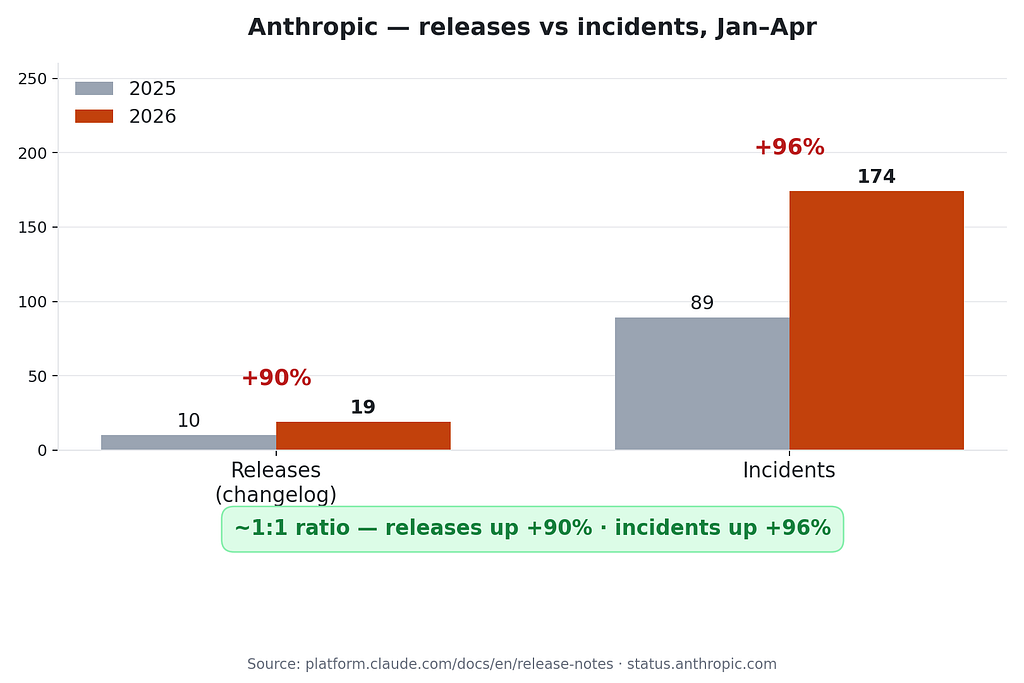
Anthropic publishes a dated changelog at platform.claude.com/docs/en/release-notes. Each release date is its own entry. I counted entries in the same four-month window I'd counted incidents over.
- 2025: 10 release entries.
- 2026: 19 release entries.
That’s +90%. Anthropic shipped nearly twice as often this year as last year.
Line up the two numbers next to each other:
- Releases: +90%
- Incidents: +96%
- Release-to-incident ratio: ~0.11 in both years
The last line is the one I keep coming back to. Each release entry, on average, generated about the same number of incidents this year as it did last year. Whatever quality bar Anthropic had a year ago, they appear to be holding. The reason the incident counter went up isn’t that each shipment got more dangerous; it’s that there are nearly twice as many shipments.
This was not the result my opening hypothesis predicted. I’m being transparent about that — the moment I saw the flat ratio, the story I’d been carrying around in my head needed to be edited in real time.
But one flat ratio at one company is not yet enough to trust. The framework I’d just landed on needed a counter-example to be credible.
What carelessness looks like in the same data
If the same approach couldn’t detect carelessness when carelessness was actually happening, it wasn’t really a framework — it was a comforting story. I needed to see it work on a case where the answer should clearly come out different.
GitHub was right there in the cohort. Same data sources, same window.
- Releases: 212 → 273 (+29%)
- Incidents: 67 → 117 (+75%)
- Incidents per release: 0.32 → 0.43
GitHub’s release pace went up modestly. Their incidents went up a lot more. Each individual release this year is producing, on average, about 35% more incidents than a release a year ago. Something about the way changes are reaching production at GitHub is more incident-prone than it used to be.
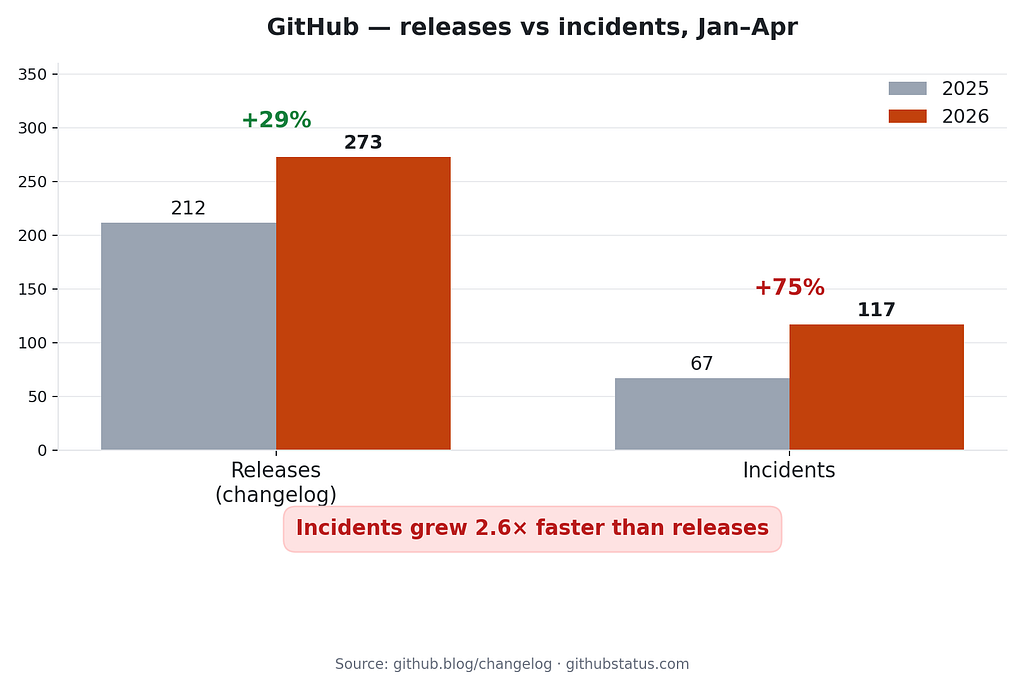
That’s the shape of quality-per-shipment slipping. Whether you want to call it “carelessness” or “a system absorbing more load than it was designed for,” the metric does what we want it to do — it tells the two cases apart.
Same source, same method, same window. Anthropic flat. GitHub clearly degraded. So the flat Anthropic ratio is signal, not noise.
So, are they being careless?
I went into this exercise from a place of mild frustration, with a working hypothesis I was half-ready to act on. Anthropic’s incidents had nearly doubled, my own team had been inconvenienced by it, my own product’s incidents were up too, and the most natural read was: something in this whole AI-adopter category has slipped.
The honest answer that came out the other end is: no.
Anthropic isn’t shipping sloppier than it did a year ago. They’re shipping nearly twice as much, while holding their quality bar roughly steady. Each release is, statistically, no more dangerous than the releases I depended on last year — there are just twice as many of them in flight. And the rest of the AI-adopter cohort, the companies whose engineering profile actually resembles mine, isn’t doubling incidents at all.
For me as head of R&D, this had two takeaways that surprised me equally.
The first is about the way I read upstream status pages. The right question, when an AI provider’s incident curve starts looking ugly, is not “did the quality bar slip?” It’s the boring follow-up: “did the volume of releases also double?” If it did, what I’m absorbing as a downstream consumer is the cost of being on a platform that’s growing, not the cost of a platform that’s degrading. The interventions I would have demanded six weeks ago — tighten your review process, slow down, prove to us you’re being careful — would have aimed at the wrong problem.
The second is about my own team. I’d been quietly suspecting we were getting careless because our incident count was creeping up. But we’ve also shipped a lot more this year than last. I haven’t yet done the version of this analysis on my own data — that’s the next thing on my list — but I now suspect I’ll find something closer to the Anthropic shape than the GitHub shape. And if I do, the response I was about to put my team through (more review, more pairing, slower merges) would have been the wrong response too.
A few honest caveats
The cohort is small. Five companies with usable status pages, only two with comparable changelog formats. The velocity-vs-carelessness comparison is really an n=2 read.
The units are blunt. A one-line bug fix and a major model launch both count as one release entry. A two-minute regional degradation and a global outage both count as one incident. None of this changes the direction of the read — Anthropic’s 2026 entries are arguably larger on average than 2025’s, which would strengthen the velocity story, not weaken it — but it should shrink your confidence interval.
I also don’t have visibility into severity. If you cared about minutes-of-downtime instead of count-of-incidents, you might get a different picture. That’s the natural next study.
The takeaway I didn’t expect
I started this expecting to confirm that someone, somewhere, was getting careless. Maybe Anthropic. Maybe the AI-adopter category. Maybe even my own team.
What I found is a less satisfying answer and a more useful one: rising incident counts are not, by themselves, evidence of carelessness. They are sometimes evidence of growth. The shape of the underlying release pace is what tells the two apart, and skipping that check is how engineering leaders end up applying culture fixes to structural problems and structural fixes to culture problems.
The diagnosis matters more than the intervention. I knew that abstractly before this. I’ll be a lot less quick to forget it the next time I see an incident curve — either on an upstream provider’s status page or on my own dashboard.
Anthropic’s Incidents Nearly Doubled This Year — Why Are They So Careless? was originally published in Level Up Coding on Medium, where people are continuing the conversation by highlighting and responding to this story.