The US stock market is under pressure on February 27, 2026, after a scorching PPI report reignited inflation fears and pushed rate-cut expectations further out.
The S&P 500, down almost 0.7%, is sliding toward a critical bearish neckline, the VIX is back above 20, and small caps are bleeding. Defensive sectors like Consumer Staples and Energy are absorbing the rotation while Financials and Technology bear the brunt. CoreWeave’s 20% plunge adds to the AI spending doubt.
Top US Stock Market News:
- Hot PPI Surprises To The Upside, Fed Rate Path In Question: January’s PPI surged 0.5% MoM (vs 0.3% expected), with Core PPI at 0.8% — nearly triple the consensus. This wholesale data feeds directly into PCE, the Fed’s preferred inflation gauge.
Rate traders are now reassessing the timeline for the first cut, with the March 17-18 FOMC meeting and updated projections becoming the next critical event for equity positioning.
*US JAN. PRODUCER PRICES RISE 0.5% M/M; EST. +0.3%
— *Walter Bloomberg (@DeItaone) February 27, 2026
*US JAN. PRODUCER PRICES RISE 2.9% Y/Y; EST. +2.6%
*US JAN. CORE PPI RISES 0.8% M/M; EST. +0.3%
*US JAN. CORE PPI RISES 3.6% Y/Y; EST. +3.0%
- AI’s Split Verdict — Nvidia Slides, Dell Surges, OpenAI Raises Big: The AI trade is fracturing. NVIDIA is down again (2.5%) after Thursday’s 5.5% drop despite beating earnings — the market wants more than beats, it wants proof of sustainable returns.
Dell surged 11% on a strong AI server forecast, showing that tangible infrastructure results still get rewarded. Meanwhile, OpenAI raised $110 billion at a $730 billion valuation, fueling bubble concerns. The divergence signals a market separating AI hype from AI delivery.
Dell rallies +11% pre-market after massive AI server guidance beat.
— WSB News (@NewsFromWSB) February 27, 2026
Q4: Adj EPS $3.89 (beat est $3.53)
Revenue $33.38B (+39% YoY, beat est $31.73B)
FY27 (ends Jan 2027) outlook:
AI server revenue ~$50B (well above expectations)
Total revenue ~$140B (beat est $126.3B)… pic.twitter.com/aZ6MrvaaMI
- US-Iran Tensions Hit Boiling Point — Embassies Evacuate, Military Options On The Table: Geneva nuclear talks ended without a deal. The US has ordered non-essential embassy staff out of Israel, Britain pulled diplomats from Tehran, and France urged citizens to identify shelters. CENTCOM briefed Trump on strike options, and Trump stated the US “may have to” act.
Oil topped $66 on the escalation — Energy (XLE), up 1.03% today and 1.53% for the week, remains the sector to watch if this tips from tension to conflict.
BREAKING: President Trump says he would "love not to" attack Iran, "but sometimes you have to."
— The Kobeissi Letter (@KobeissiLetter) February 27, 2026
Inflation Shock Hits Wall Street as Small Caps Bleed
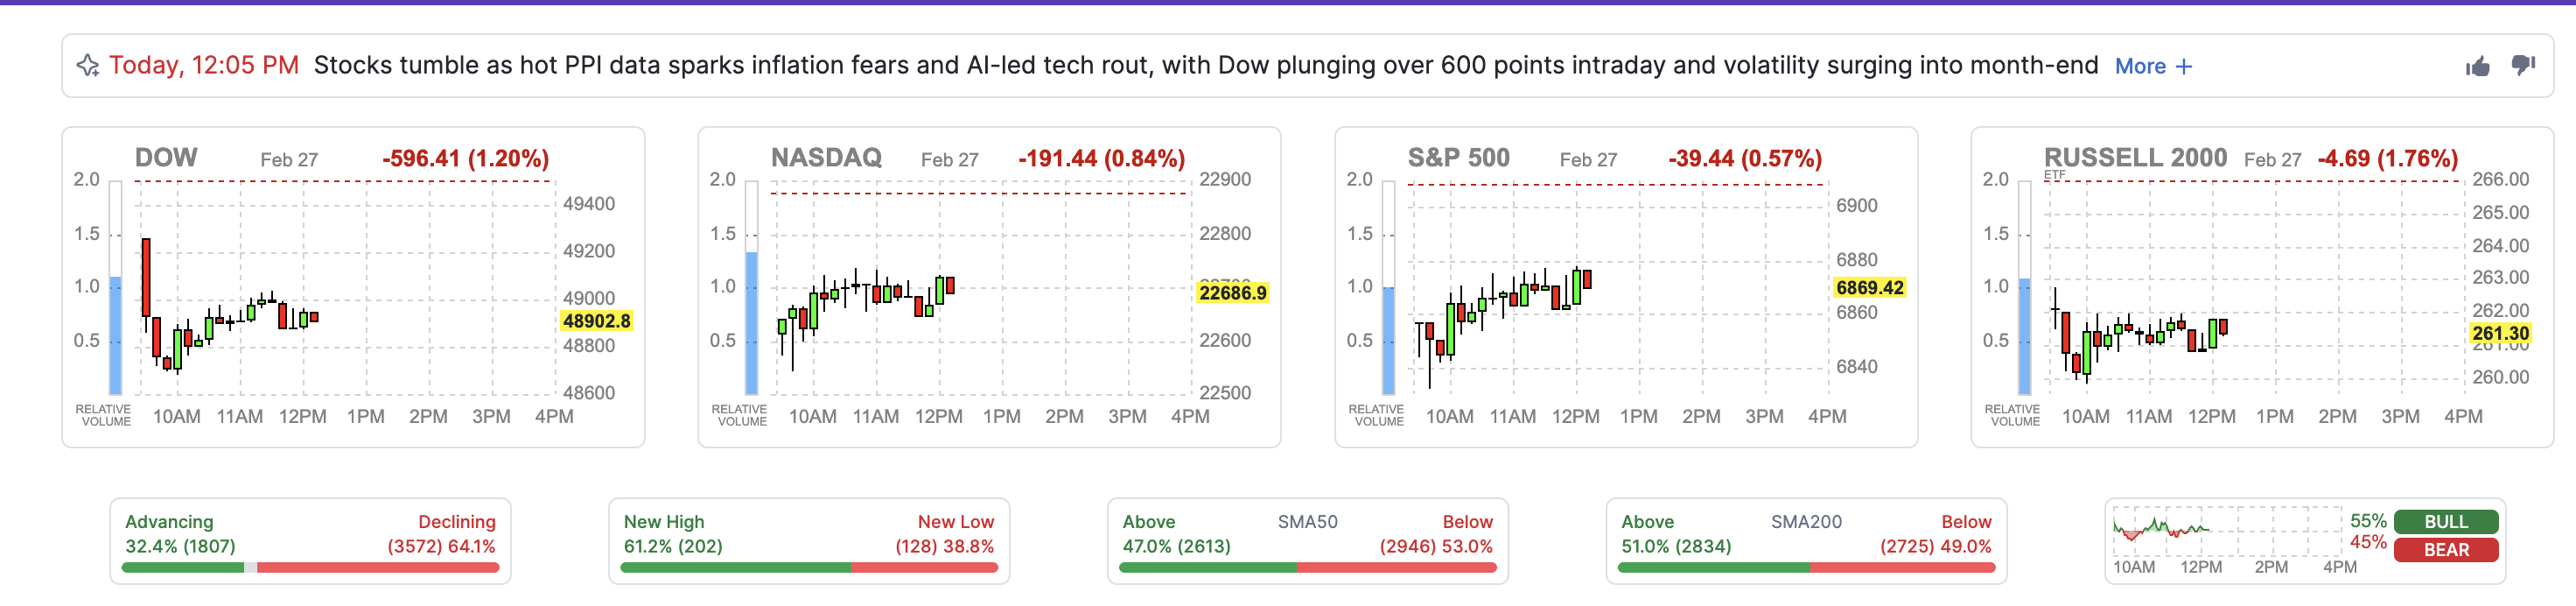
The US stock market is selling off on February 27, 2026, after January’s Producer Price Index (PPI) came in scorching hot — headline at 0.5% MoM (vs 0.3% expected), Core PPI at 0.8% (vs 0.3% expected). At press time, 64% of stocks are declining.
The Dow Jones is down 567 points (-1.15%), the S&P 500 is off nearly 0.6%, and the Nasdaq is down 0.77%.
But the real pain is in the Russell 2000, down 1.76% — small caps are getting hammered hardest because they carry more variable-rate debt and are most sensitive to higher-for-longer rate expectations.
When inflation runs hot, small companies with tighter margins and weaker pricing power feel it first.
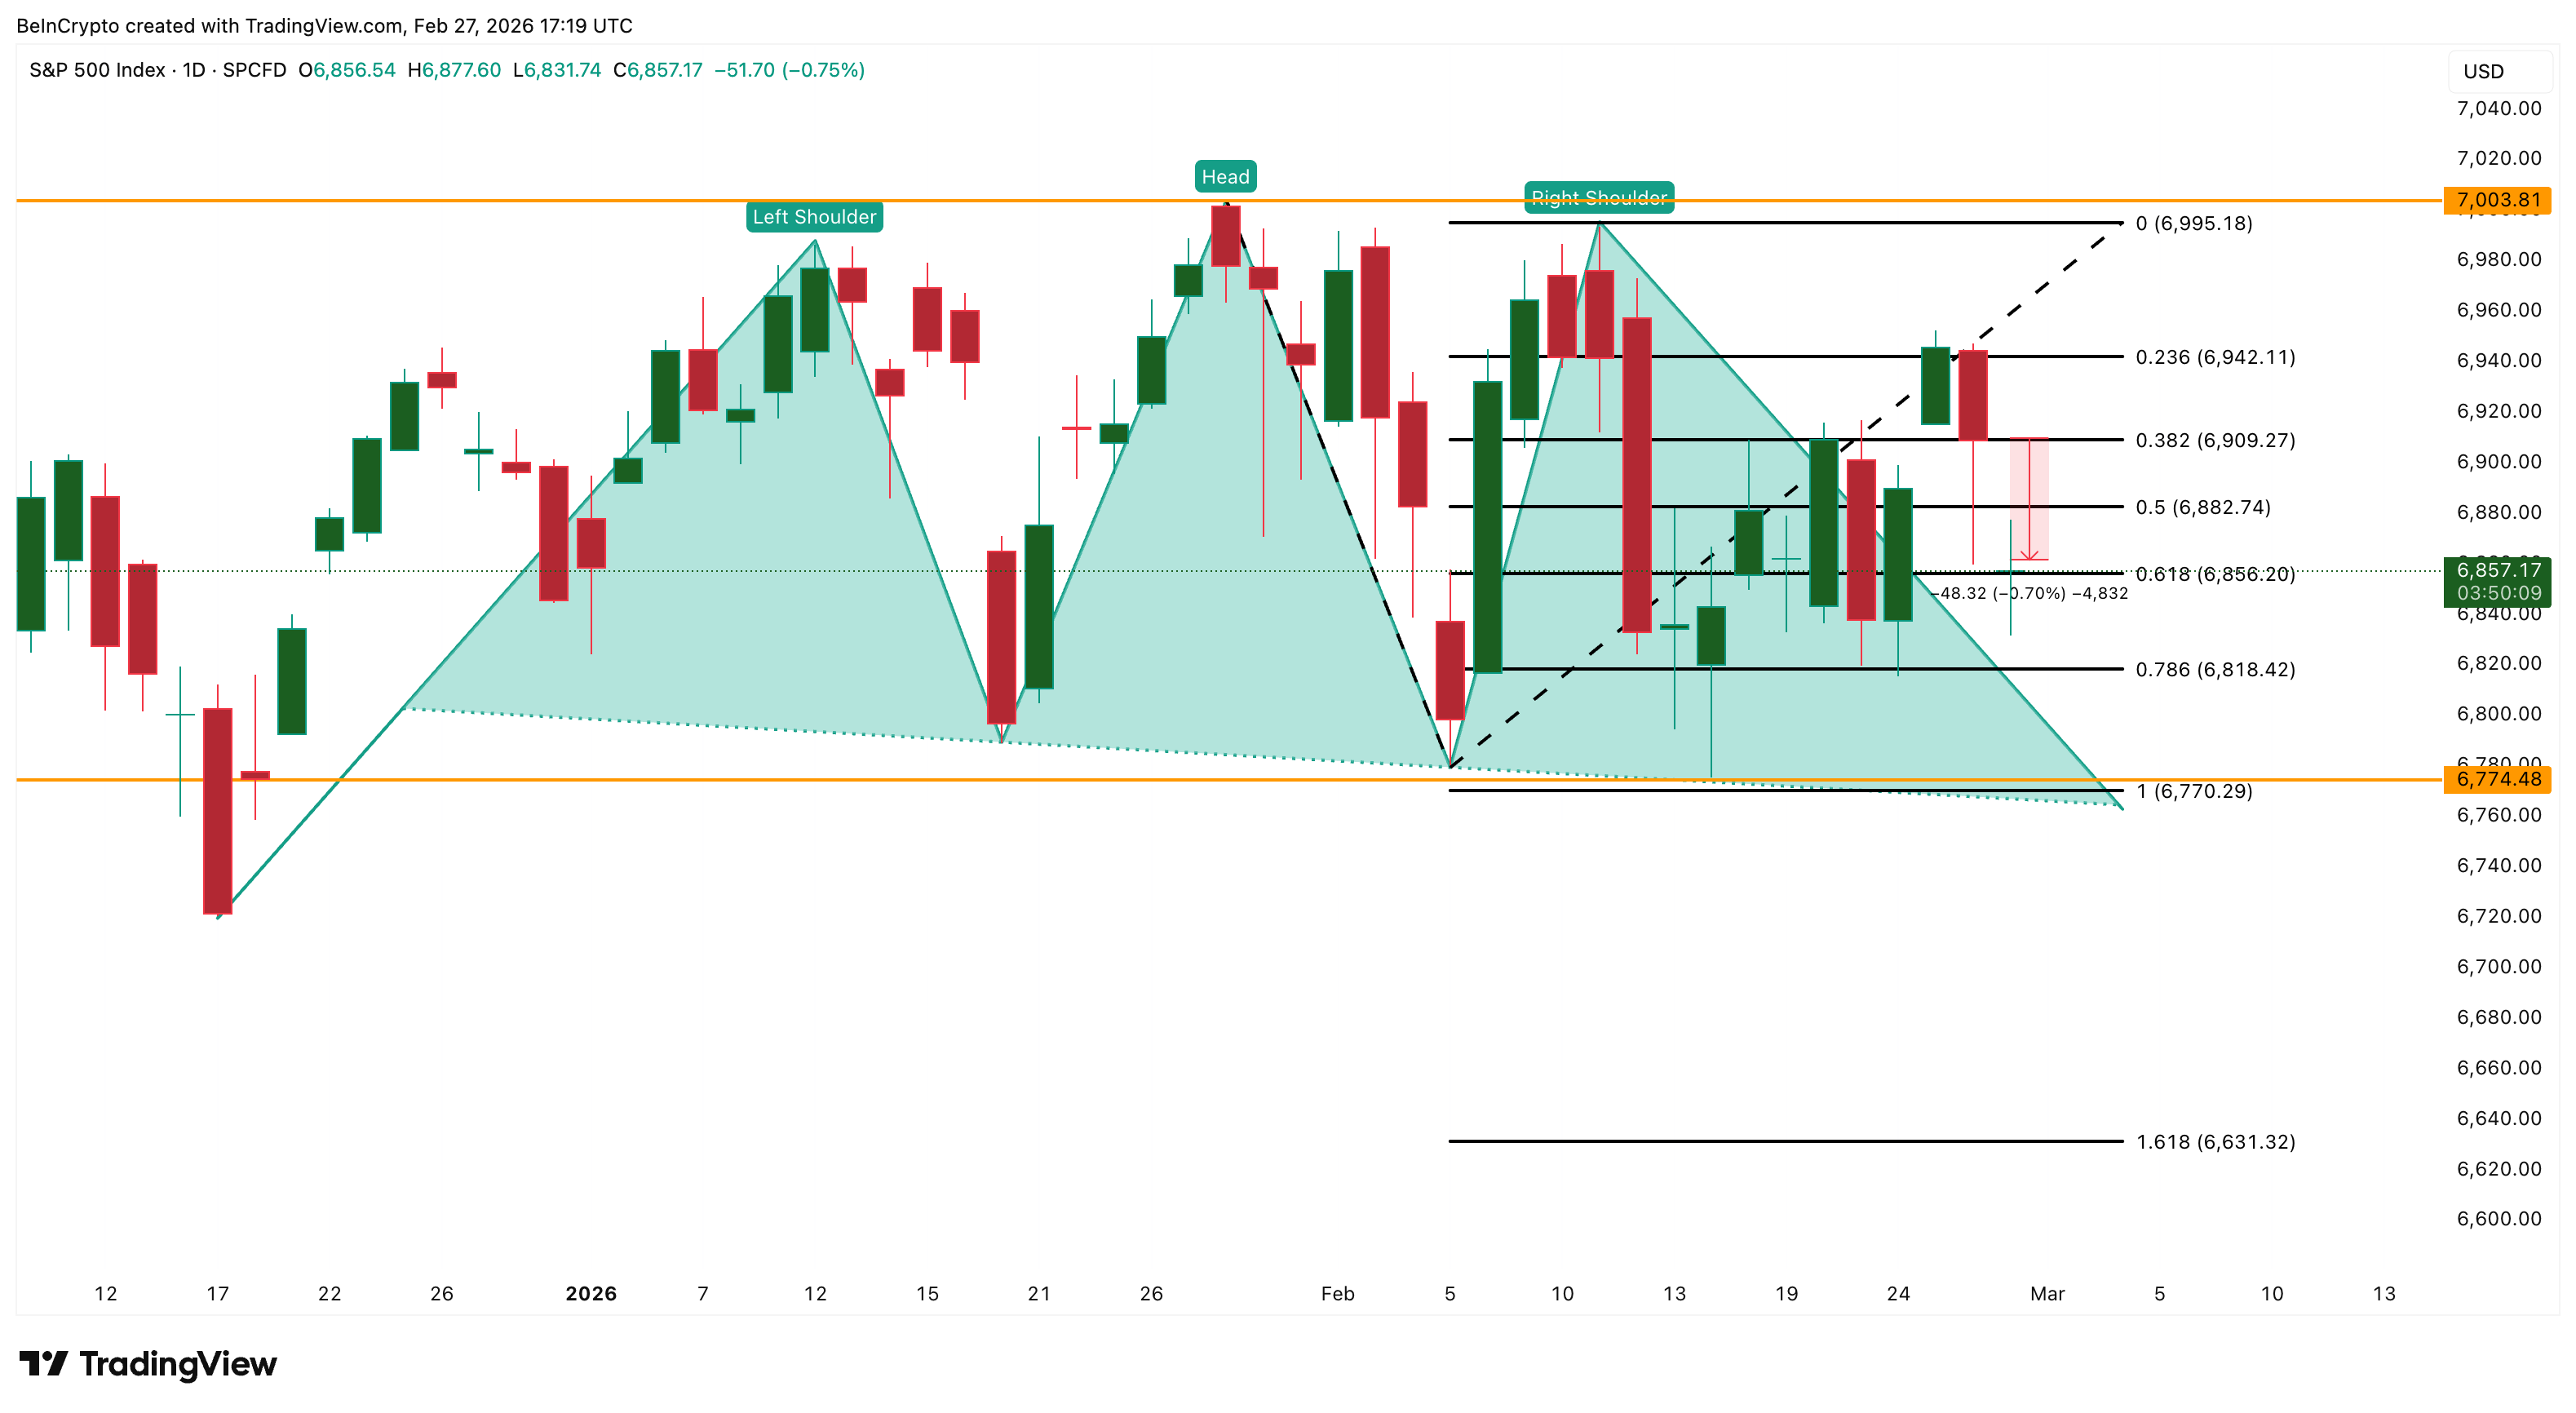
S&P 500 Slides Toward Head And Shoulders Breakdown
The S&P 500 is trading near 6,860 at press time, down $0.60-0.70% from yesterday’s close and gradually approaching the head and shoulders neckline we flagged in our previous analysis. The key support at 6,770 is now close.
A daily close below that level activates the pattern and exposes a measured move toward 6,630 — roughly a 3% decline. To regain control, bulls need to reclaim 6,900 and push through 6,940.
With markets closed over the weekend, Monday’s open becomes critical.
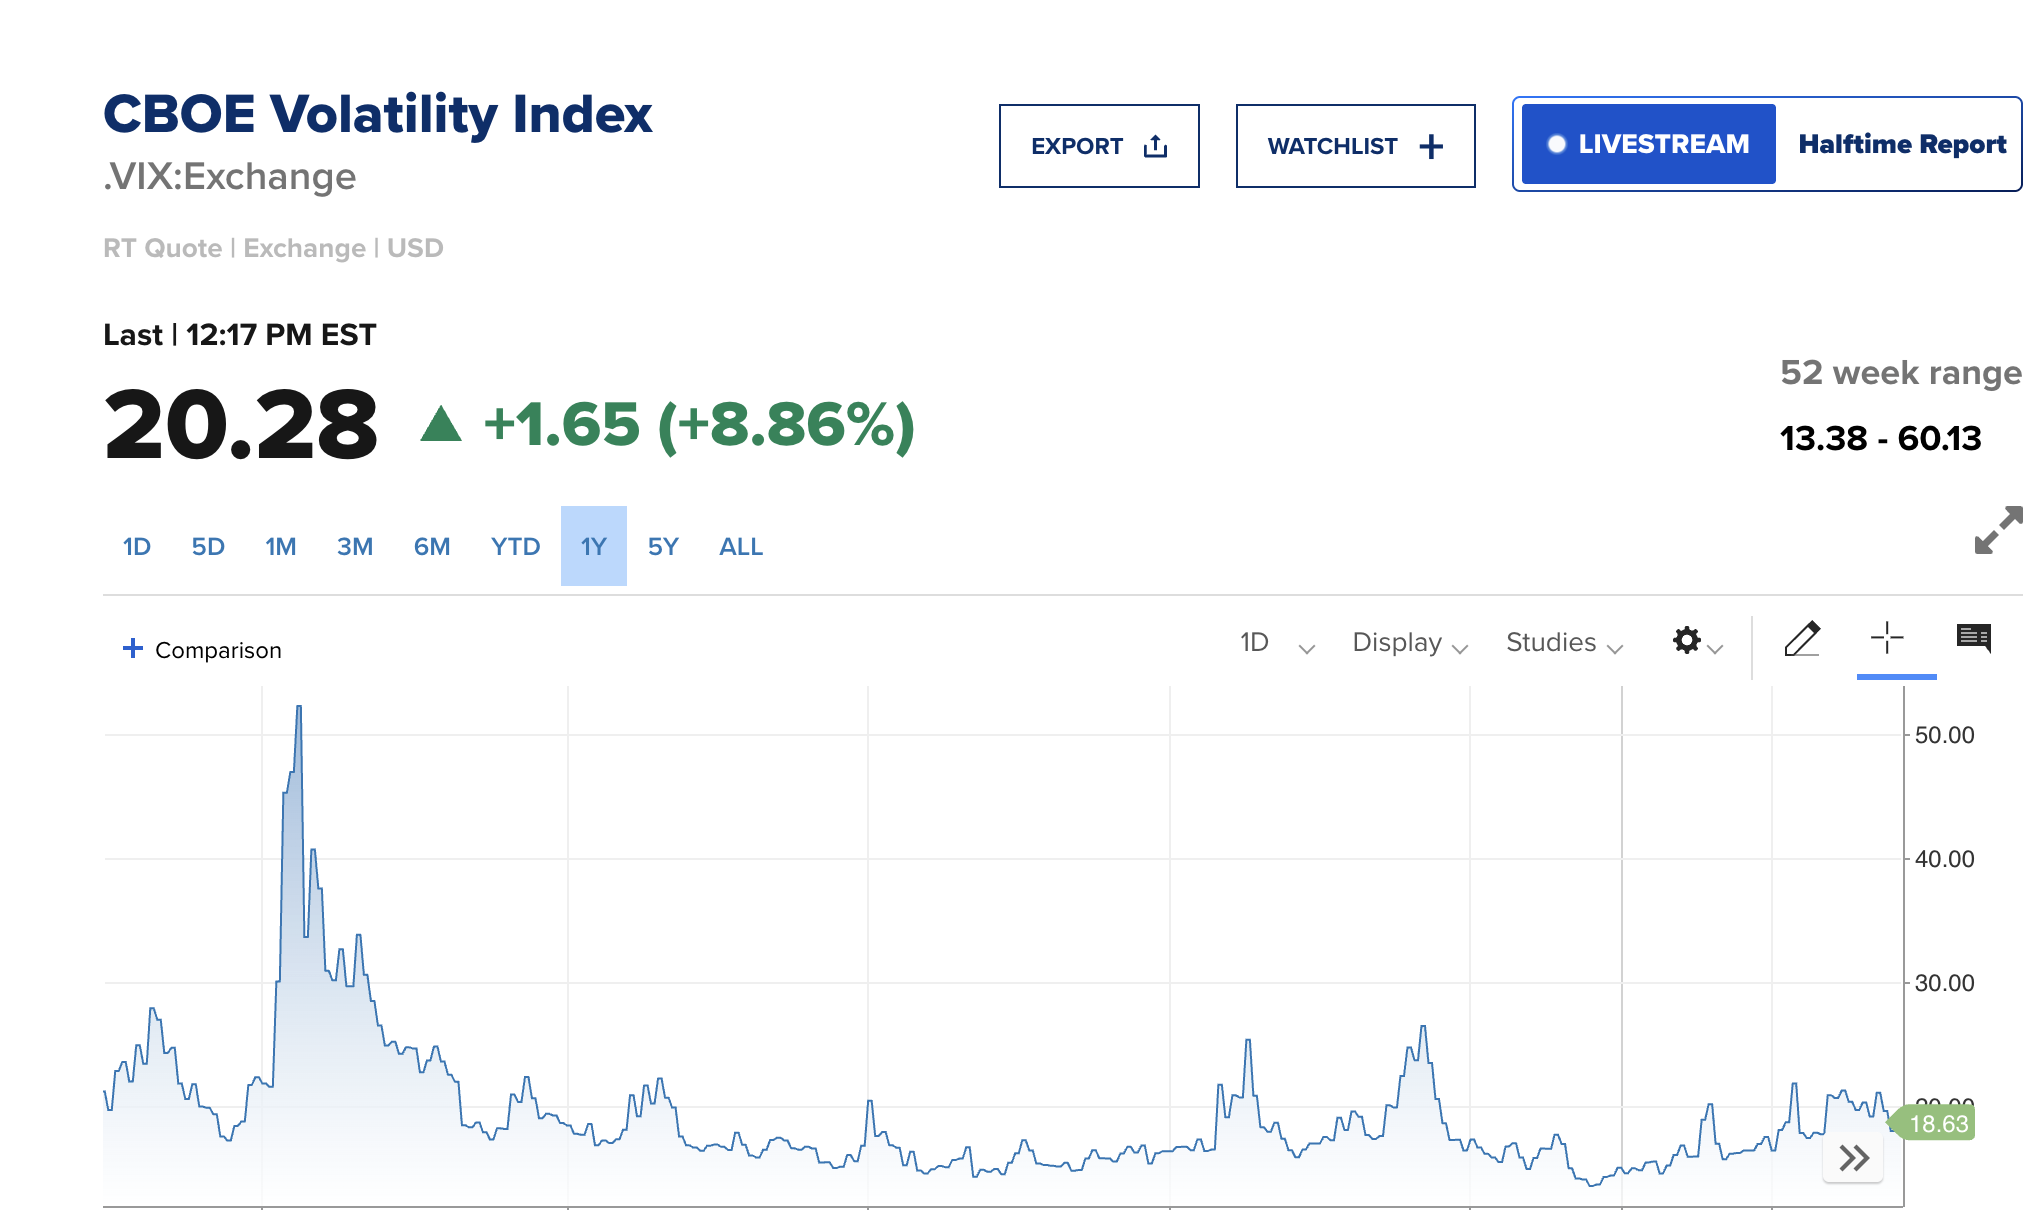
The CBOE Volatility Index (VIX) has surged 8.86% to 20.28, confirming that fear is building — not dissipating. February has been relentless, and the VIX climbing back above 20 reflects a market caught between sticky inflation, AI uncertainty, and geopolitical risk.
The 10-year Treasury yield has dropped to 3.975% (proxy for rising bond prices), down 4 basis points from yesterday. But this is not a bullish signal for stocks. Bonds are rallying on flight-to-safety demand — investors are parking money in Treasuries amid economic uncertainty.
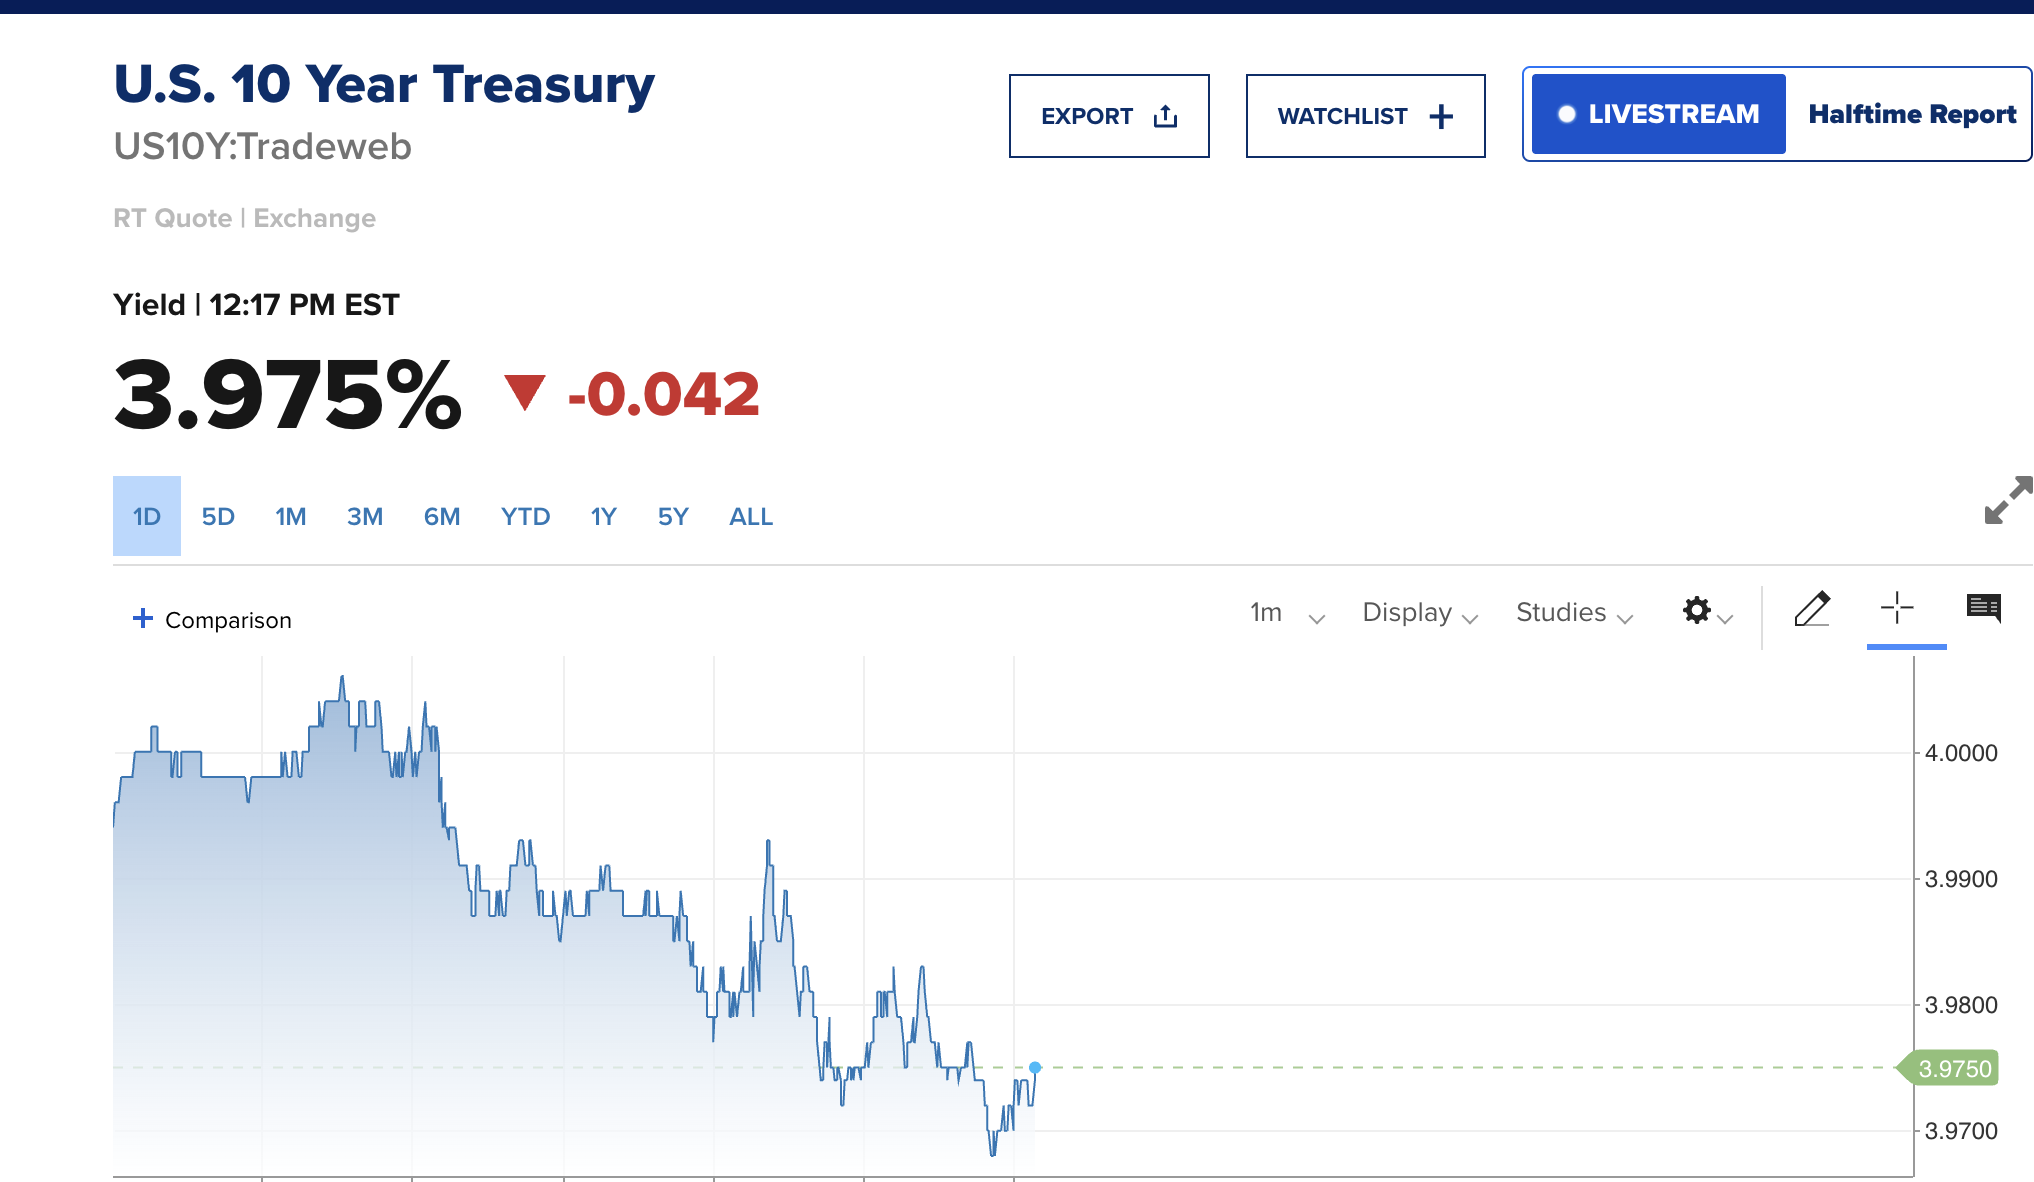
Today’s hot PPI data actually pushes rate cut expectations further out. The FOMC meets March 17-18 with updated projections, and every inflation print between now and then carries outsized weight.
US-Iran nuclear talks in Geneva are adding another layer of caution.
2026 Fed Meeting Dates (FOMC)
— Schaeffer's Investment Research (@schaeffers) December 10, 2025
Jan 27-28
Mar 17-18 ★
Apr 28-29
Jun 16-17 ★
Jul 28-29
Sept 15-16 ★
Oct 27-28
Dec 8-9 ★
★ = Meetings w/ economic projections (SEP) pic.twitter.com/BBKvD6oMN2
Any escalation could spike oil prices and compound the inflation problem that today’s PPI just underscored.
Defensives And Energy Lead As Financials Crumble
The sector map on February 27, 2026, paints a clear risk-off picture. Investors are rotating into safety and commodities while dumping rate-sensitive and growth sectors. Consumer Staples (XLP) leads today at +1.28%.
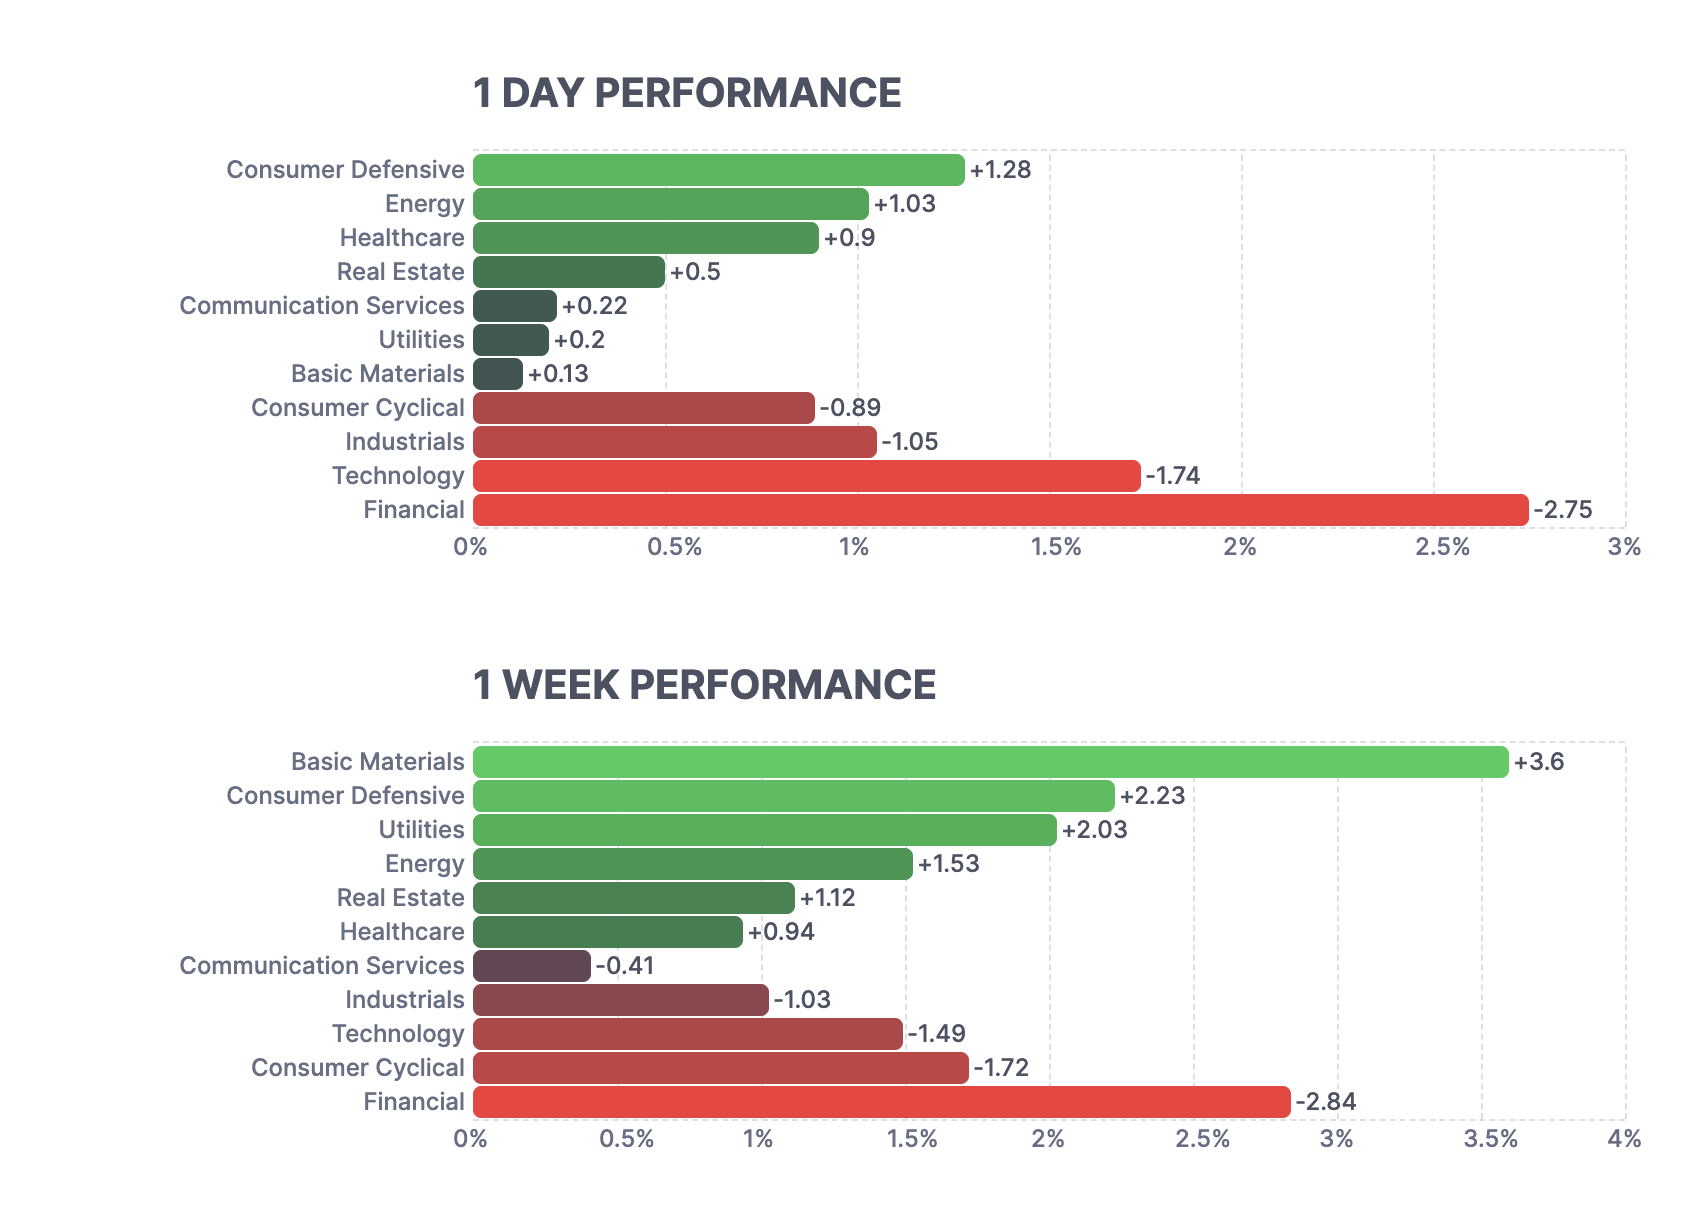
When inflation runs hot, staples outperform because companies like Procter & Gamble and Coca-Cola have pricing power — they pass higher costs to consumers. XLP is also up 2.23% on the week, confirming this isn’t a one-day trade but a sustained defensive rotation.
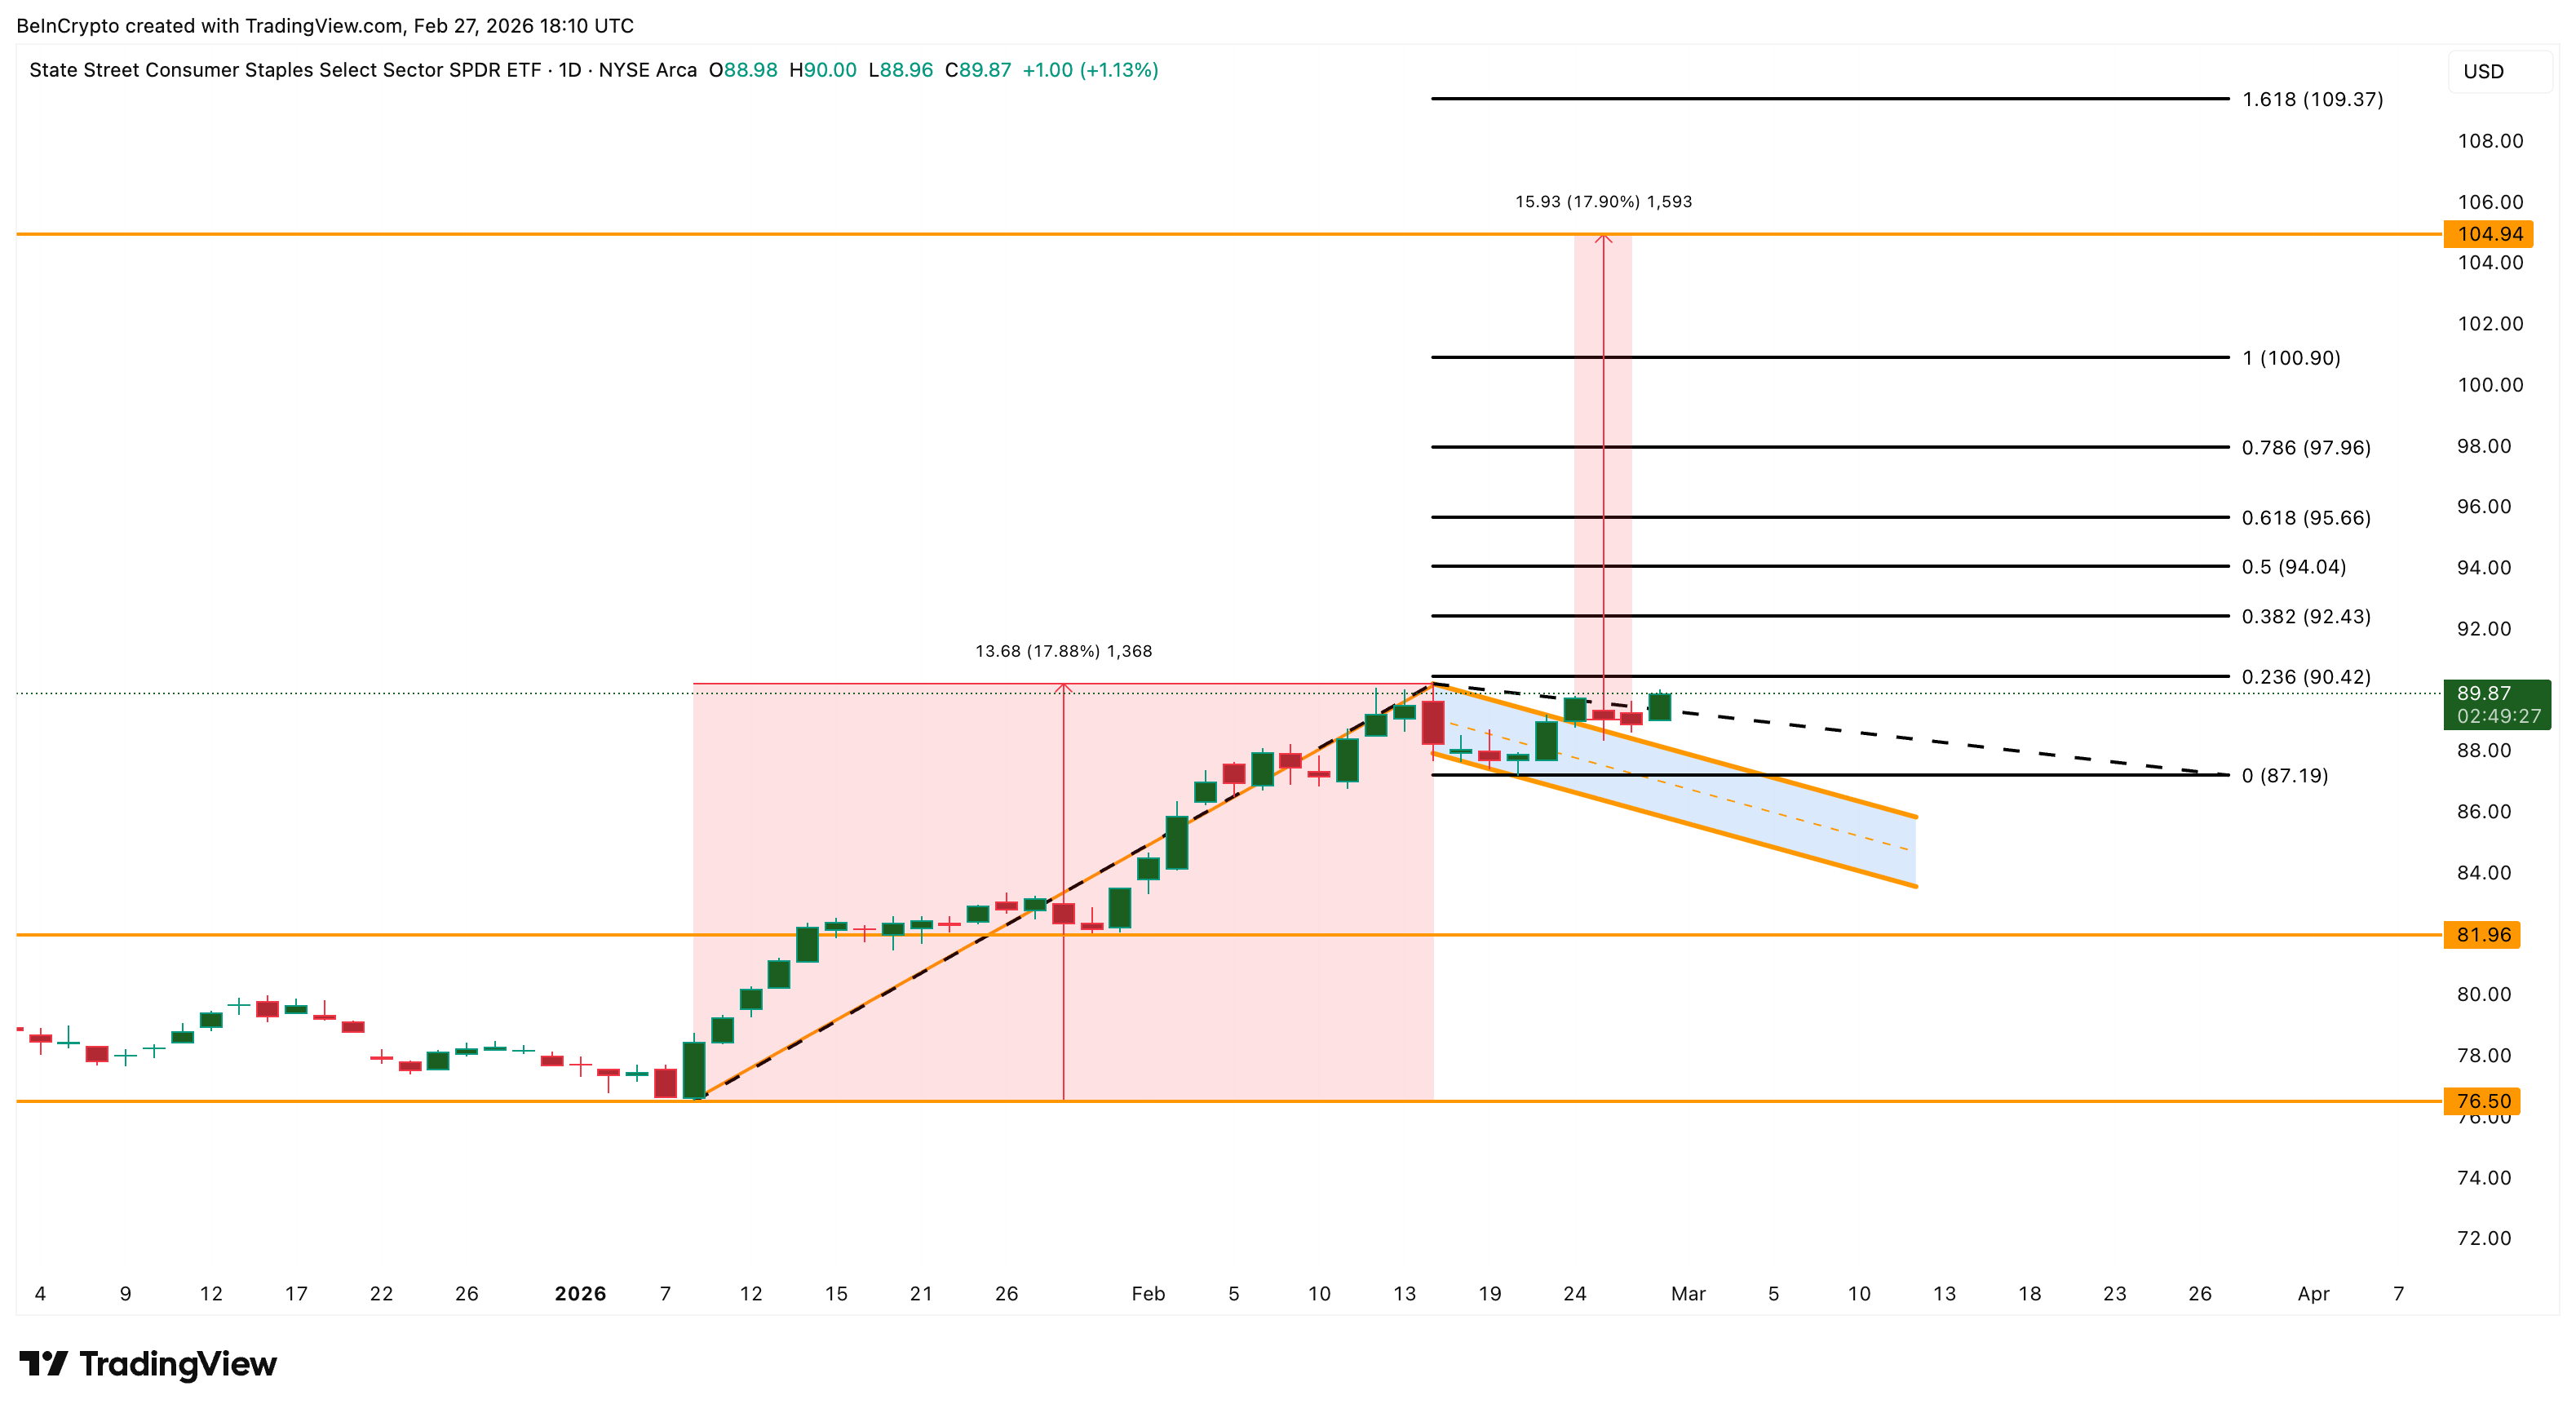
The chart reinforces this conviction. XLP has rallied nearly 18% since January 8, broke out of a bullish flag on February 24, and is currently trading above $89.
The breakout targets $95–$100, with an extended move toward $104. A pullback to $87 is possible on broader US stock market weakness, but only a fall below $81 invalidates the bullish structure.
Basic Materials (XLB) tells the weekly story best. Up 3.60% for the week; the strongest sector by far, reflecting surging commodity demand from AI infrastructure buildout.
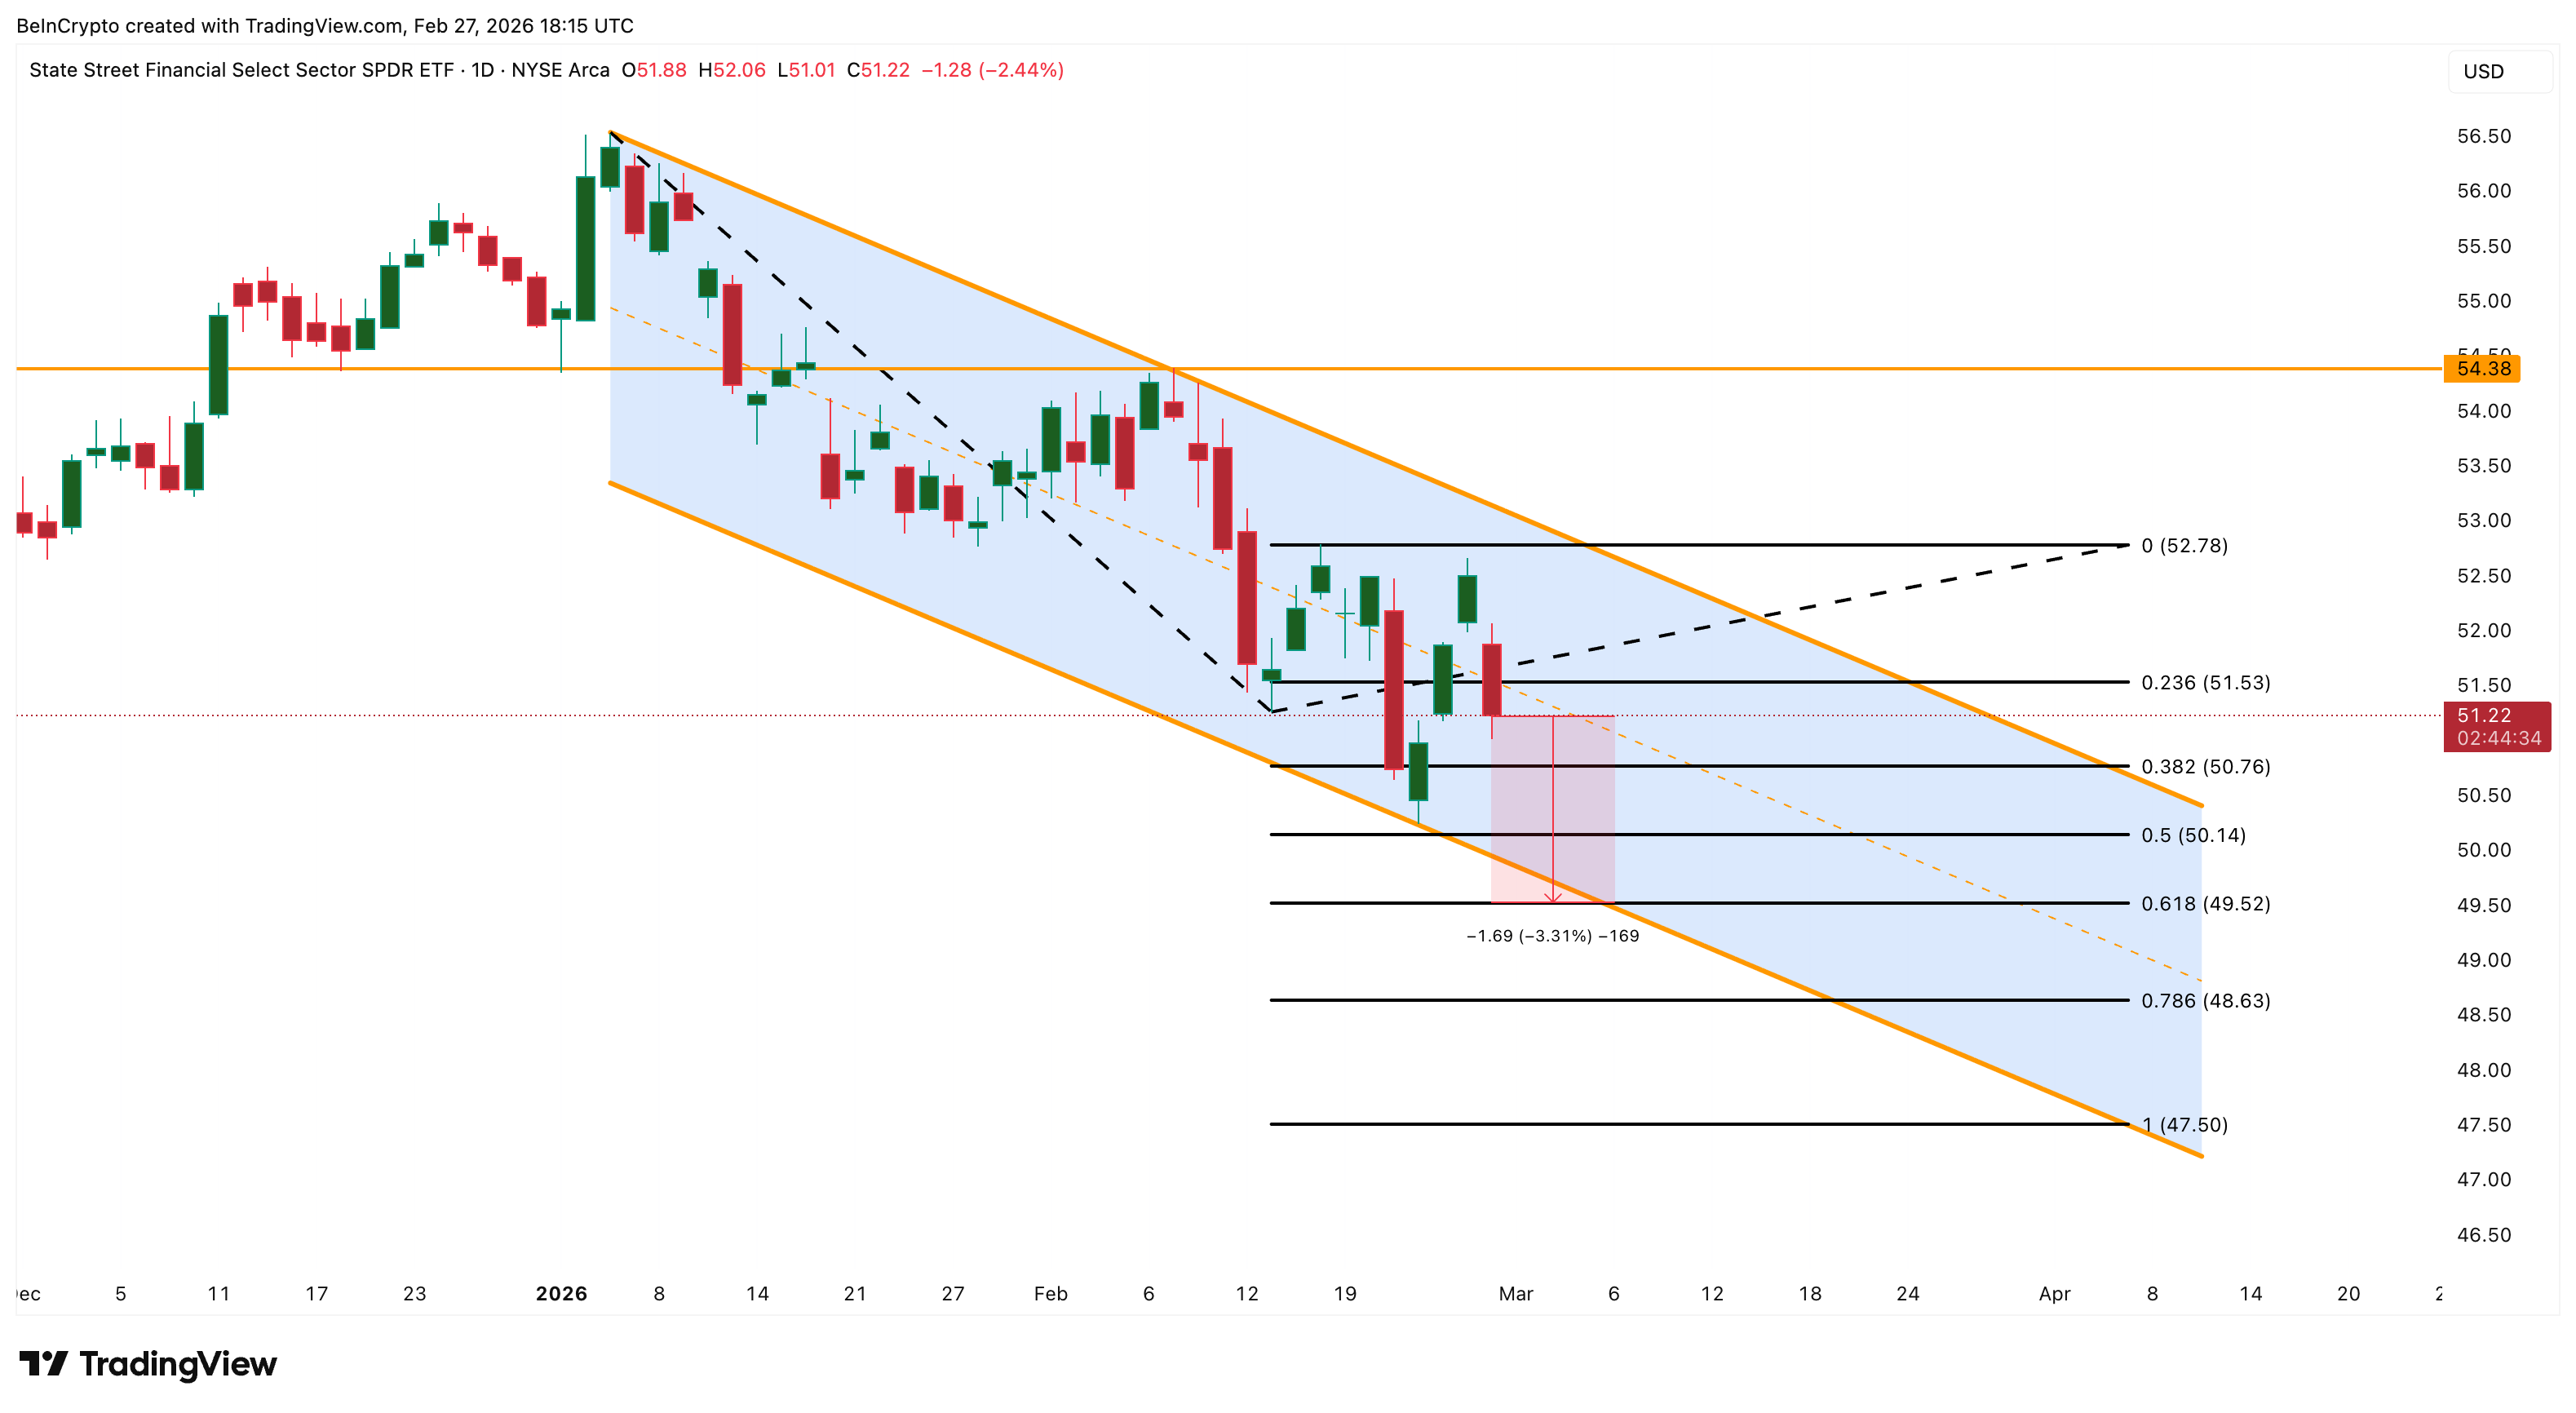
On the downside, Financials (XLF) are getting crushed — down 2.75% today and -2.84% for the week, the worst performer on both timeframes. The damage is multi-layered. Hot PPI data pushes rate cut expectations further out, which normally helps bank margins — but not when it comes alongside economic uncertainty that raises loan default risks.
XLF has been trading inside a descending channel since January 6 and is currently near $51. A move above $54 is required to show genuine bullish strength.
However, if tariff tensions build and loan default risks increase, breaking the lower trendline of the descending channel at $49 could prime it for the $47 zone.
The weekly picture reinforces the rotation and textbook risk-off positioning heading into a weekend loaded with uncertainty.
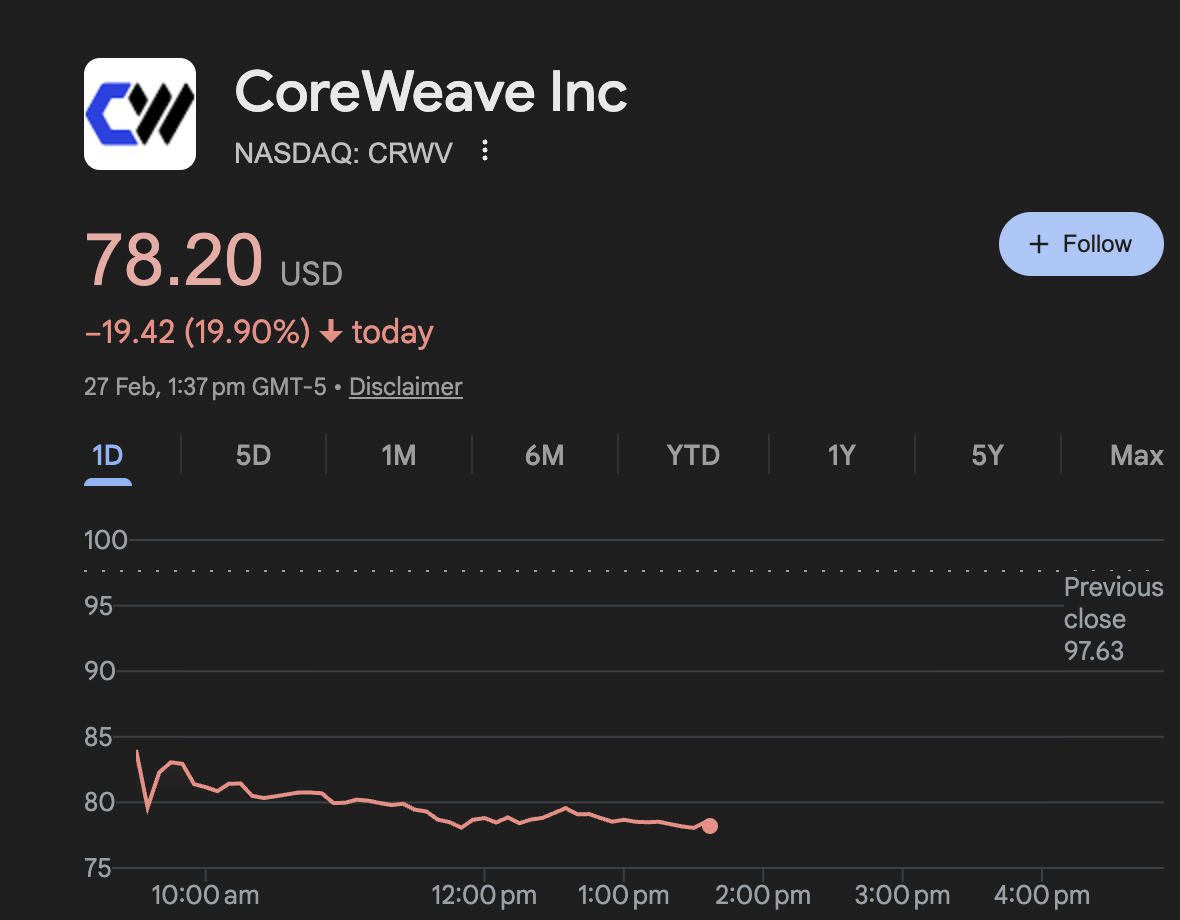
CoreWeave Plunges 20% After Missing Estimates
CoreWeave (CRWV), a Nasdaq-listed AI cloud infrastructure provider that rents out GPU computing power to companies running AI workloads, is down 20% today to $78.09 — its worst single-day drop since listing. The stock is not an S&P 500 component but deserves attention as a direct barometer of AI infrastructure sentiment.
The catalyst: CoreWeave missed profit estimates, reinforcing the “prove it” mood gripping AI-linked stocks this week.
Combined with Nvidia’s continued slide and OpenAI’s $110 billion fundraise, which has raised valuation concerns, the result is a US stock market questioning whether AI capex returns can justify the spend.
It’s hard to overstate how bad the $CRWV results/guidance were, but consider this: CoreWeave would still be losing money if they depreciated their GPU’s over 10 years! And at a conservative industry-standard 6-yr life, Coreweave would have zero EBIT coverage of their interest. pic.twitter.com/6HiizAOeKs
— James Chanos (@RealJimChanos) February 27, 2026
The drop is dramatic in context. As recently as February 25, CRWV was trading above $103. It was building toward a potential inverse head-and-shoulders breakout above a $124 neckline.
In just two sessions, the stock has cratered 25%, collapsing through multiple Fibonacci support levels.
At $78, the structure is wounded but not dead. A drop below $73 would significantly weaken the pattern. And a close under $63 would invalidate the inverse head-and-shoulders pattern entirely and turn the outlook bearish.
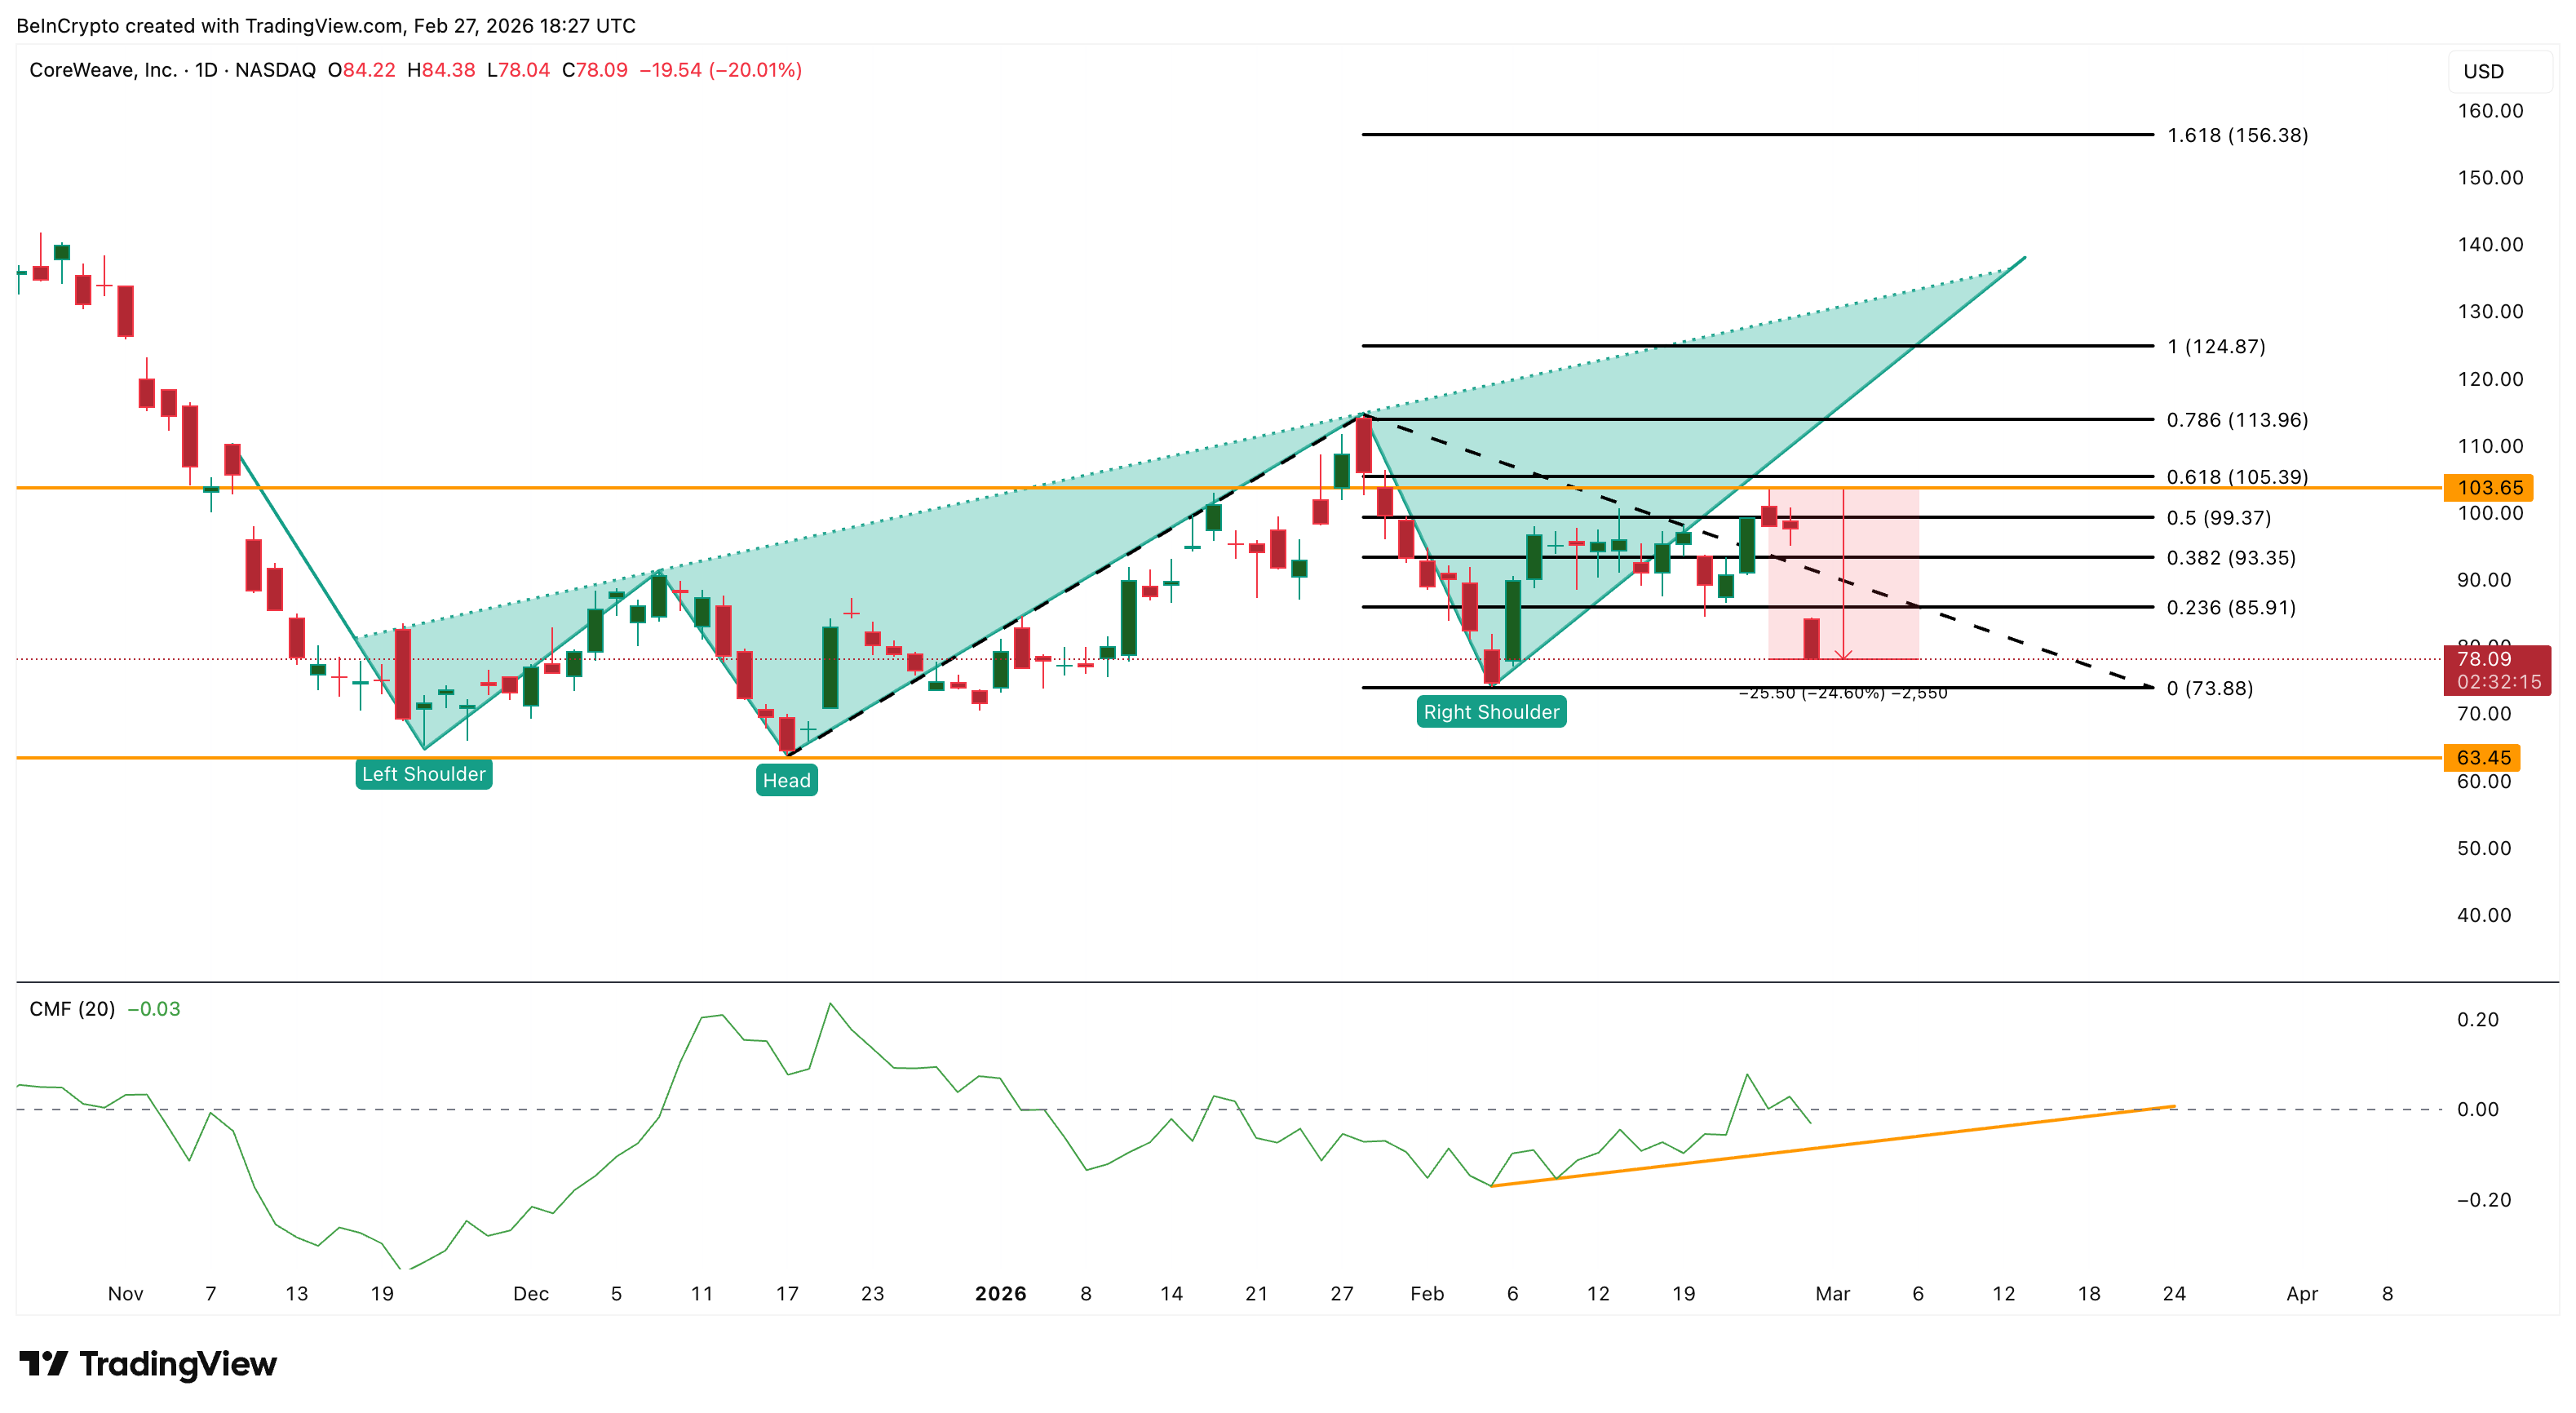
However, the Chaikin Money Flow (CMF) indicator, a proxy for big money flows, offers a sliver of hope. While CMF has dipped alongside price, the decline is manageable — the broader CMF uptrend since February 5 remains intact.
If institutional money flow holds above its trendline and reclaims the zero line, it would signal that smart money is treating this as a shakeout rather than a structural breakdown.
Year-to-date, CoreWeave is essentially flat. Today’s plunge has wiped out nearly all of 2026’s gains in a single session. The stock needs to hold $78 and see CMF stabilize for any recovery thesis to remain alive.
The post Why Is the US Stock Market Down Today? appeared first on BeInCrypto.


