The Coin Flip that Broke Mathematics
 Namrata Priyadarshani5 min read·Just now
--
There’s a puzzle from 1713 that accidentally discovered one of the deepest truths about market, gambling, wealth and survival. Once you understand it, you’ll know what’s wrong with most trading strategies.
The Game
I flip a fair coin. If it lands heads, then you earn $2 and the game ends. Tails, we flip again. Heads on second flip earns you $4. Tails, flip again. Heads on third pays $8. The payout doubles each round. The game ends the first time Heads shows up.
The question is simple: How much should you pay to play this game?
Let’s calculate the expected value:
EV = (1/2) * 2 + (1/4) * 4 + (1/8) * 8 + …
Every term equals 1. So, the sum is infinite. Which means that the math says you should pay any amount $1000, $1000000, your house, your kidney anything to play this game.
But nobody would actually do that. Most people wouldn’t even pay $15 to play this game. WHY??
This contradiction broke probability theory for almost 200 years.
Try simulating it at your end
If you simulate the game million times you’ll see most payouts are tiny. Median is mostly $2 or $4. Most of the times heads show up in the first or the second flip and you go home.
But the mean is wild. It can sometimes reach thousands of dollars. Why? Because once in a blue moon, tails has 20 streak. That one game pays millions. And this single game drags the average to absurdly large number.
Every run gives a different number and the mean never settles. Large samples doesn’t help here too.
Fat-tailed World
Most games paid tiny but a handful of games paid enormously high and those games dominated the average, no matter how big samples you took. This is the shape of a fat tail.
In a thin-tailed world like height, IQ, weight, car speed… Central Limit Theorem rescues you. You can take a handful of sample and confidently find the mean. The extremes are bounded enough that they can’t dominate.
In a fat-tailed world, rare events dominates the average. The single event can contribute more than 999999 events contribute. Here, the average is just a noisy signal.
Markets have this exact shape. A tiny number of events dominate everything.
A few trading days generate most long term market return.
A few catastrophic losses wipe out decades of volatility selling returns.
https://medium.com/@numpie/how-i-blew-up-my-account-selling-volatility-770d8663f405
Which mean you can’t meaningfully trust the average return of trading strategies.
In fat-tailed world average is dangerously misleading!
SPY: Measuring in real world
I pulled SPY’s data from 2005 onwards. This amounts to roughly 5000 trading days.
I computed basic stats and results makes SPY look beautifully behaved. Daily mean return is around 4 bips. Standard deviation is around 1.2%. If we assume a gaussian model then the prediction of a 5-sigma move would be probably once every 15000 years.
In actual data, there’s 17 days on which it happened. The largest single day drop is around -11% and largest gain is around 14.5% which are statistically impossible in gaussian distribution.
If I calculate CAGR of SPY from this data, I get 10.5% annual growth. And from the same data, I remove only the 10 best days and the CAGR drops to 6%.
These 10 out of ~5000 days accounts for around half the return in twenty years.
This is the example of fat-tailed world where the tiny number of events dominates the mean return. Backtesting with and without these 10 days makes the SPY good to invest and mediocre ETF.
What I’ve been playing with is what if I buy when SPY drops down more that 1–2%. Does it recover the next day?
The mean return I found is around 16–35 bips compared to normal 4 bips. This sounds like an edge. But as usual mean says nothing. If we look into distribution carefully, we’ll observe that the standard deviation has almost doubled. Medians next-day are less impressive than mean. It means there are a few monster reversal days which carries the entire edge. Unlucky window means edge gone.
Same lesson! In a fat-tailed world the mean does not tell you the actual distribution.
Bernoulli’s Resolution
Ever heard people talking about lognormal distributions in market? All the time.
Daniel Bernoulli point out something very obvious in hindsight that people don’t maximize money. They maximize the utility of money. And utility is roughly logarithmic in wealth.
Going from $1000 to $2000 changes your life. But going from $1000,000 to $1001,000 doesn’t. The marginal utility of dollars decreases as you have more dollars.
Let’s redo the expected utility of coin-flip game:
EV = (1/2) * log(2) + (1/4) * log(4) + (1/8) * log(8) + …
The sum converges to log(4). Finite, reasonable, player pays around $4 to play the game.
Suddenly, puzzle has the answer that matches what one would pay intuitively and it also matches the median outcomes.
This is the birth of expected utility theory. It sits at the foundation of almost everything in finance.
Why log keeps showing up
Bernoulli’s fix looks like a hack.
Fast forward 200 years, Black-Scholes equation prices every option on every exchange in the world. It doesn’t model the stock price. It models the log of stock price.
The reason is obvious once you see it. Stocks don’t move in dollars, they move in percentage. And percentage is just log difference camouflage. Anything that compounds lives more naturally in log space.
A stock that goes up 10% one year and down 10% the next has an “average” return of zero. The actual return is -1%. The swings eat the compounding from the inside.
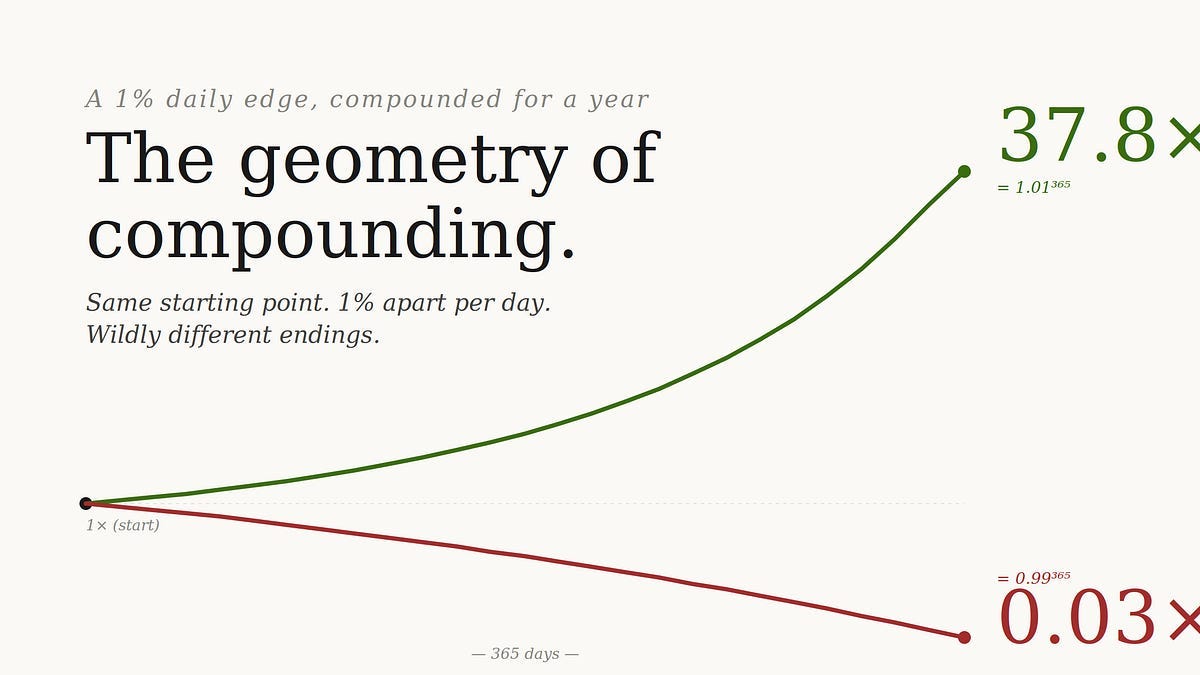
Even you compound in everyday life. Grow 1% everyday and you grow ~37.8 in a year. Get 1% worse everyday and you end up at ~0.03. Same arithmetic distance but wildly different places.
Constants in Chaos
One → in a fat-tailed world, “average” is a lie. When you read the fund return 20% on average, ask immidiately: dominated by how many observations? If 10 days drive half the return, the mean is the property of those 10 days and not of the strategy itself. Look at the entire distribution, the median, the tail, the worst days and know that mean can often be misleading.
Two → Compounding lives in log space, not in dollar space.
Averages lie in fat-tailed worlds. Volatility eats compounding. And the strategy that quietly prints money for nine months may be the same one that goes to zero on the tenth.
The difference between getting rich and getting broke is often just one tail event you assumed would never happen.
Originally published at https://namratapriyadarshani.substack.com.