Momentum, mean-variance optimisation, and multi-asset portfolios: a systematic comparison of five allocation strategies
Mean-variance optimisation has been a cornerstone of portfolio theory since Markowitz (1952), yet the vast majority of retail portfolios still rely on a single heuristic: buy a global equity index and hold it indefinitely. The approach is defensible in theory — broad diversification, low cost, minimal effort — but it leaves a measurable gap between what systematic allocation methods can deliver and what most individual investors actually capture.

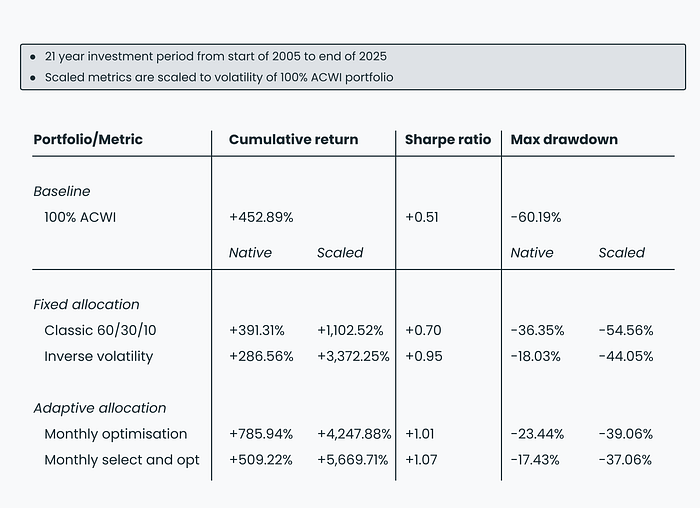
This article compares five portfolio strategies over the 2005–2025 period, progressing from a static equity baseline to adaptive, momentum-filtered multi-asset approaches. The goal is not to declare a winner but to quantify the trade-offs between complexity, risk-adjusted return, and tail risk — and to show how combining asset selection with allocation optimisation produces materially different risk profiles than static weighting alone.
The five strategies:
- Baseline: 100% ACWI (MSCI All Country World Index — global equity)
- Fixed allocation: Classic 60/30/10 (global equity / US Treasuries / gold)
- Fixed allocation: Inverse volatility weighting across the same three asset classes
- Adaptive allocation: Monthly mean-variance optimisation across 4 ETFs
- Adaptive allocation: Monthly momentum-based selection from 10 assets, then mean-variance optimisation on the top 5
All strategies are fully systematic — rules-based, replicable, and free of discretionary judgement. This matters empirically, not just philosophically: Barber and Odean (2000) demonstrated that frequent discretionary trading significantly reduces returns for individual investors. Systematic execution removes that drag.
Why risk metrics matter as much as returns
Before examining the results, it is worth establishing the evaluation framework. Comparing strategies on absolute return alone is incomplete. Two additional dimensions are critical for any investor who must actually live with a portfolio over a multi-year horizon:
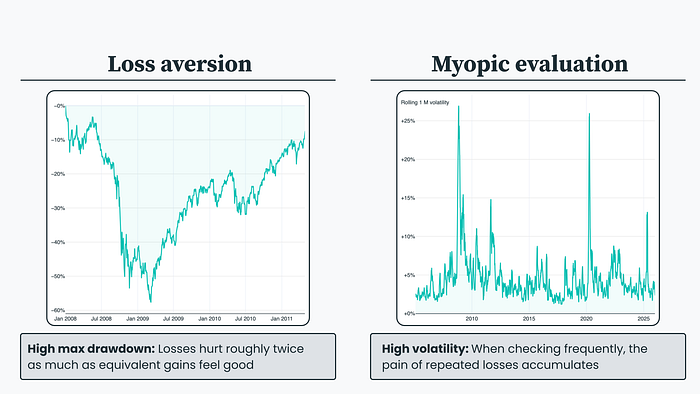
Loss aversion. Kahneman and Tversky (1979) established that losses carry roughly twice the psychological weight of equivalent gains. A portfolio with a −60% maximum drawdown does not merely deliver poor short-term performance — it creates a level of distress that makes strategy abandonment highly likely at precisely the worst moment.
Myopic loss aversion. Benartzi and Thaler (1995) showed that frequent portfolio evaluation amplifies the pain of volatility. High-volatility portfolios generate more frequent negative observations, each increasing the probability that the investor exits the strategy prematurely.
These are not soft behavioural observations — they describe systematic, well-documented biases that erode realised returns. A strategy that delivers 10% annualised but induces abandonment after a 50% drawdown is inferior, in practice, to one delivering 8% annualised that the investor actually holds for two decades.
We therefore report Sharpe ratios, maximum drawdown, and peak rolling volatility alongside absolute returns. We also report volatility-scaled versions of each strategy: these use leverage to match each portfolio to ACWI’s risk level, enabling direct comparison of returns and drawdown characteristics at equivalent volatility. Native statistics are what a DIY investor would actually experience; scaled statistics reveal the underlying efficiency of each approach.
Strategy 1: 100% ACWI — the equity baseline
The all-equity portfolio is the simplest construction: buy one globally diversified equity ETF and hold.
Native results (2005–2025):
- Total return: +453%
- Annualised volatility: 19%
- Maximum drawdown: −60%
- Peak one-month rolling volatility: 27%
- Sharpe ratio: +0.51
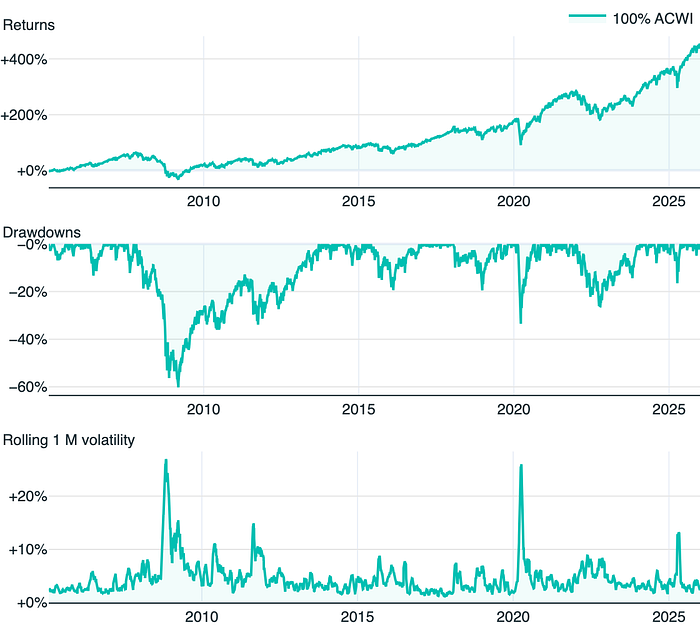
The drawdown figure is the critical data point. During the 2008 financial crisis, global equities fell over 50% from peak to trough. In early 2020, markets dropped roughly 30% in weeks. For an investor holding USD 100,000, a peak rolling volatility of 27% translates to potential monthly swings of ±USD 27,000 — more than a quarter of total capital appearing or disappearing within 30 days.
Faced with this, many self-directed investors hold large cash buffers as a psychological hedge. This is economically inefficient — the investor has created an ad-hoc multi-asset allocation without the benefits of systematic diversification or rebalancing. It raises the question: can a more deliberate multi-asset approach deliver comparable returns with materially less tail risk?
Strategy 2: classic 60/30/10
The traditional multi-asset split — 60% global equity (ACWI), 30% intermediate US Treasuries (IEF), 10% gold (GLD). Rebalancing is triggered when allocations drift beyond a threshold, typically 5–10%.
Native results (2005–2025):
- Total return: +391%
- Annualised volatility: 11%
- Maximum drawdown: −36%
- Peak one-month rolling volatility: 16%
- Sharpe ratio: +0.70
Volatility-scaled results (matched to ACWI’s 19% volatility):
- Total return: +1,103%
- Maximum drawdown: −55%
- Sharpe ratio: +0.70

The absolute return lags ACWI by 14%, but volatility is nearly halved and maximum drawdown improves from −60% to −36%. The Sharpe ratio rises from +0.51 to +0.70 — the portfolio extracts meaningfully more return per unit of risk. Volatility-scaling reveals this clearly: at equity-equivalent risk, the 60/30/10 would have delivered +1,103% versus +453%.
Strategy 3: inverse volatility weighting
A mechanical alternative to fixed weights: allocate inversely to each asset’s trailing volatility. More volatile assets receive smaller allocations. Over this period, the resulting weights were approximately 58% IEF, 22% GLD, 20% ACWI — a bond-heavy, defensive posture.
Native results (2005–2025):
- Total return: +287%
- Annualised volatility: 7%
- Maximum drawdown: −18%
- Peak one-month rolling volatility: 7%
- Sharpe ratio: +0.95
Volatility-scaled results:
- Total return: +3,372%
- Maximum drawdown: −43%
- Sharpe ratio: +0.95

The native return is the lowest of the five strategies, but the risk profile is radically different. A maximum drawdown of −18% and peak rolling volatility of 7% mean severe market crises barely register in portfolio value. The Sharpe ratio of +0.95 — nearly double the equity baseline — demonstrates that the strategy captures return more efficiently per unit of risk than any fixed-weight or pure equity approach.
The limitation of fixed weights
Both fixed strategies share an inherent vulnerability: prolonged asset class underperformance. Bonds delivered negative real returns through much of the 2010s. Gold stagnated for over nine years after its 2011 peak. Fixed weights continue allocating capital to underperforming assets regardless of conditions. The diversification benefit is real, but the drag from sustained weakness in one component is equally real.
This motivates the question behind adaptive strategies: can systematic reallocation based on quantitative signals — momentum and cross-asset correlations — reduce that drag while preserving the diversification benefit?
Strategy 4: monthly mean-variance optimisation across 4 ETFs
The first adaptive approach uses four ETFs — IEF (US Treasuries), GLD (gold), EFA (developed markets ex-US equity), IVV (S&P 500) — and runs a maximum Sharpe ratio optimisation monthly using a 48-month lookback window. No discretionary input; the allocation follows directly from trailing returns, volatilities, and the covariance matrix.
Native results (2005–2025):
- Total return: +786%
- Annualised volatility: 11%
- Maximum drawdown: −23%
- Peak one-month rolling volatility: 9%
- Sharpe ratio: +1.01
Volatility-scaled results:
- Total return: +4,248%
- Maximum drawdown: −38%
- Sharpe ratio: +1.01
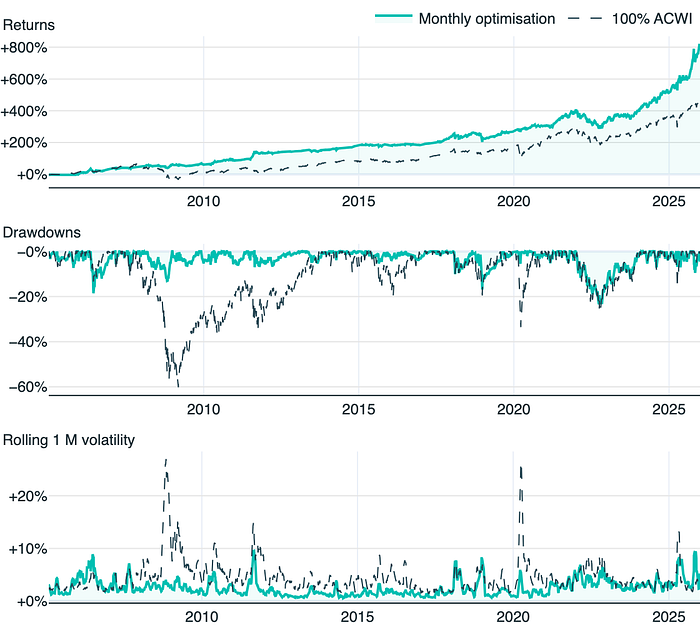
This is the first strategy to break the Sharpe ratio 1.0 barrier — double the equity baseline. The native portfolio outperforms ACWI in absolute terms (+786% versus +453%) while cutting maximum drawdown from −60% to −23% and volatility from 19% to 11%. The improvement is not marginal; it is a structurally different risk-return profile.
The mechanism is transparent: mean-variance optimisation tilts allocations toward assets exhibiting better recent risk-adjusted characteristics. When equity momentum deteriorates, the optimiser shifts weight toward bonds or gold. When equity signals strengthen, it increases equity exposure. No forecasting, no views — just trailing statistics applied consistently.
Strategy 5: momentum selection + mean-variance optimisation from 10 assets
The second adaptive approach adds an asset selection layer before optimisation. The universe expands to 10 ETFs: GLD (gold), UUP (US dollar), EFA (developed markets ex-US), QQQ (Nasdaq-100), IVV (S&P 500), IEF (intermediate Treasuries), TLT (long-term Treasuries), EEM (emerging markets), BND (US aggregate bonds), BNDX (international bonds).
The methodology operates in two stages:
- Selection: each month, rank all 10 assets by trailing 12-month Sharpe ratio. Select the top 5. This is a time series momentum filter — the mechanism documented by Moskowitz, Ooi, and Pedersen (2012), who showed that recent price performance contains a systematic signal for future returns across asset classes. Assets with weak recent risk-adjusted performance are excluded entirely.
- Allocation: run maximum Sharpe ratio optimisation on the selected 5, determining optimal weights from trailing returns and the covariance matrix.
Native results (2005–2025):
- Total return: +509%
- Annualised volatility: 8%
- Maximum drawdown: −17%
- Peak one-month rolling volatility: 9%
- Sharpe ratio: +1.07
Volatility-scaled results:
- Total return: +5,670%
- Maximum drawdown: −38%
- Sharpe ratio: +1.07
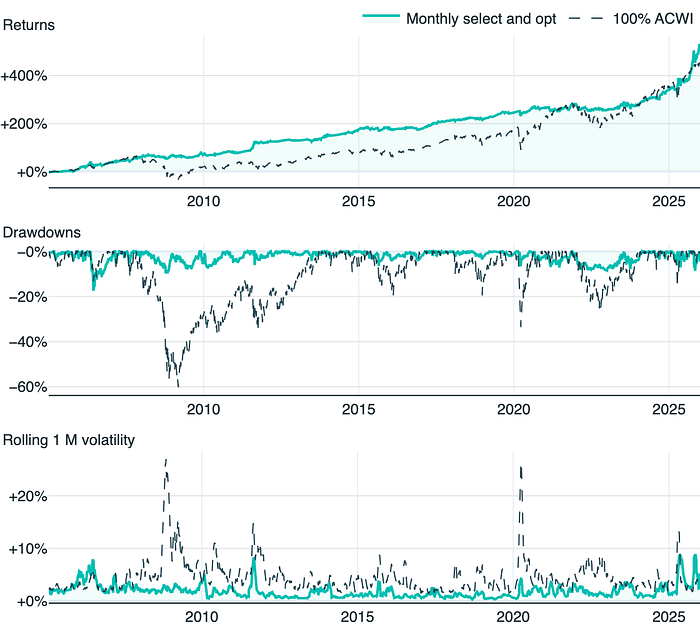
The highest Sharpe ratio of any strategy examined: +1.07, with the shallowest maximum drawdown at −17%. Native absolute return (+509%) modestly exceeds the equity baseline (+453%), but the risk reduction is dramatic — volatility drops from 19% to 8%, and maximum drawdown from −60% to −17%.
The dual-layer process — momentum-based selection followed by mean-variance optimisation — is the key mechanism. The selection layer eliminates assets in persistent decline, avoiding the fixed-weight problem of continually allocating to underperformers. The optimisation layer then constructs the most efficient portfolio from the remaining candidates. Each layer contributes independently; their combination produces the strongest risk-adjusted result.
A known limitation: momentum crashes
Momentum strategies are sensitive to sharp, sudden reversals. When an asset’s trend reverses abruptly — as occurred in certain equity markets during March 2020 — the trailing momentum signal lags the reversal, and the portfolio may hold assets whose trend has already broken.
Multi-asset diversification is the primary defence. A momentum crash in one asset class does not cascade across a portfolio holding uncorrelated assets. The 10-asset strategy’s −17% maximum drawdown — experienced during a period that included both the 2008 financial crisis and the 2020 pandemic crash — suggests the diversification buffer is meaningful in practice, even if it cannot eliminate the risk entirely.
Summary: complexity, efficiency, and the Sharpe frontier
Strategy Total return Volatility Max drawdown Sharpe ratio 100% ACWI (baseline) +453% 19% −60% +0.51 60/30/10 fixed +391% 11% −36% +0.70 Inverse volatility +287% 7% −18% +0.95 Monthly optimisation (4 ETFs) +786% 11% −23% +1.01 Selection + optimisation (10 assets) +509% 8% −17% +1.07
The progression is clear: each step in methodological sophistication — from static equity, to fixed multi-asset weights, to adaptive optimisation, to momentum-filtered selection plus optimisation — produces a measurable improvement in risk-adjusted efficiency.
The trade-off is operational complexity. The equity baseline requires no ongoing attention. Fixed allocations require occasional rebalancing. Adaptive strategies require monthly recalculation — computing trailing returns, volatilities, covariance matrices, and running an optimiser. For a practitioner comfortable with Python, NumPy, and a basic quadratic optimiser, the implementation is straightforward. For someone who is not, the infrastructure requirement is real.
The choice depends on three factors: investment horizon, tolerance for drawdowns, and willingness to maintain a systematic process. No strategy is universally optimal. But the data over this 20-year period is unambiguous: adaptive, multi-asset, momentum-aware allocation strategies deliver materially better risk-adjusted returns than static equity or fixed-weight alternatives.
For those interested in implementing these approaches without building the infrastructure from scratch, platforms like pfolio provide pre-built portfolios using this dual-layer methodology — momentum-based asset selection combined with mean-variance optimisation — with monthly rebalancing instructions executed through the investor’s own broker.
The core insight holds regardless of implementation: systematic portfolio construction need not mean static allocation. Rules-based strategies that combine asset selection with allocation optimisation can adapt to changing market regimes while eliminating the behavioural drag that undermines discretionary decision-making.
References
Barber, B. M., & Odean, T. (2000). Trading is hazardous to your wealth: The common stock investment performance of individual investors. The Journal of Finance, 55(2), 773–806. doi.org/10.1111/0022–1082.00226
Benartzi, S., & Thaler, R. H. (1995). Myopic loss aversion and the equity premium puzzle. The Quarterly Journal of Economics, 110(1), 73–92. doi.org/10.2307/2118511
Kahneman, D., & Tversky, A. (1979). Prospect theory: An analysis of decision under risk. Econometrica, 47(2), 263–291. doi.org/10.2307/1914185
Markowitz, H. (1952). Portfolio selection. The Journal of Finance, 7(1), 77–91. doi.org/10.1111/j.1540–6261.1952.tb01525.x
Moskowitz, T. J., Ooi, Y. H., & Pedersen, L. H. (2012). Time series momentum. Journal of Financial Economics, 104(2), 228–250. doi.org/10.1016/j.jfineco.2011.11.003
This article was first published on the pfolio blog. Read the original post here.
Disclaimer: This article constitutes advertising within the meaning of Art. 68 FinSA and is for informational purposes only. It does not constitute investment advice. Investments involve risks, including the potential loss of capital.
Your Business — On AutoPilot with DDImedia AI Assistant
(Join Our Waitlist)
Visit us at DataDrivenInvestor.com
Join our creator ecosystem here.
DDI Official Telegram Channel: https://t.me/+tafUp6ecEys4YjQ1
Follow us on LinkedIn, Twitter, YouTube, and Facebook.
Momentum, mean-variance optimisation, and multi-asset portfolios: a systematic comparison of five… was originally published in DataDrivenInvestor on Medium, where people are continuing the conversation by highlighting and responding to this story.