I Analyzed 90 Days of Yield Correlations. Most “Diversified” DeFi Portfolios Aren’t.
 Iván Alberquilla5 min read·Just now
--
How to use correlation to spot fake diversification — and build a portfolio that actually behaves like one.
You picked five USDC vaults. Maybe one each on Morpho, Aave, Compound, Euler, and Fluid. The names are different. The curators are different. The smart contracts are different.
You feel diversified.
You’re not.
I pulled 90 days of APY data across the major lending markets and ran correlation between every pair. Most of the “diversified” portfolios I see on Crypto Twitter are mathematically the same bet, repeated five times with different logos.
Here’s how to spot the trap — and how to build a portfolio that actually behaves like one.
The illusion of diversification
When most people talk about “diversifying” their DeFi yield, they mean spreading across protocols. One vault on Morpho, one on Aave, one on Euler. Different brands, different curators — must be safer, right?
That’s brand diversification. It’s not return diversification.
Return diversification is about correlation — how closely two positions move together over time. Two vaults can be on completely different protocols and still earn yield from the exact same underlying source. When that demand spikes, all of them spike. When it drops, all of them drop. You don’t have a portfolio. You have one position in five wrappers.
The math that actually matters is the correlation between two vaults’ daily yield series over a meaningful window — say, 90 days.
- +1.0 → they move identically
- 0 → they move independently
- -1.0 → they move opposite
You only get the benefit of diversification when correlation is meaningfully below +0.5. Above that, you’re mostly compounding the same bet.
A worked example
Let me show you what this looks like in practice. I picked one anchor — Steakhouse Prime USDC on Morpho ($468M TVL, 4.5% current APY) — and pulled the 90-day correlation between it and every other tracked USDC lending instrument.
Here’s a slice, sorted by correlation:
A few things jump out.
Same protocol, very different correlation. Four of these five are on Morpho. Their correlations to Steakhouse Prime range from -6.8% to +21.3%. So “diversify across protocols” is the wrong lens. You can build a real portfolio entirely on Morpho — if you pick by correlation, not by curator brand.
Negative correlation exists, and it’s hiding in plain sight. Gauntlet USDC-C clocks -6.8% against Steakhouse Prime. Both are Morpho vaults. Both quote similar APYs. But their 90-day return paths move in mildly opposite directions, which means combining them actually reduces the volatility of your blended return rather than just averaging it.
Why lending vaults correlate so tightly
If you think about where lending yield actually comes from, the high correlations stop being surprising.
When someone borrows USDC on Aave, Morpho, Euler, or Compound, they’re usually doing one of two things: shorting USDC against an appreciating asset (long ETH or BTC with USDC debt) or looping stablecoin LP positions. The aggregate demand for those trades drives the borrow rate, and the borrow rate drives the supply APY on every protocol — roughly in sync.
Add to that the fact that big curators (Steakhouse, Gauntlet, MEV Capital) run similar mandates across protocols — same collateral types, same risk parameters, same target utilization — and structural correlation is baked in.
This is why “I’m on five different protocols” isn’t the flex you think it is. The protocols are downstream of the same demand curve.
How to build a real portfolio in four steps
Here’s the methodology I use:
Step 1: Pick an anchor
Start with one position you have real conviction in. For me, that’s usually a curated vault with a long track record and TVL above $100M. Steakhouse Prime, Gauntlet USDC Prime, Aave USDC core market — all reasonable anchors.
Step 2: Find your diversifier
Look for instruments with negative or near-zero 90-day correlation to the anchor. Not by hunting for unrelated protocols, but by reading the actual correlation matrix.
In the table above, Gauntlet USDC-C (-6.8%) and USDbC (+0.2%) both qualify. Notice that one of them is on the same protocol as the anchor.
Step 3: Reject lookalikes
When you’ve added a second position, check the pairwise correlation between everything you hold. If any pair is above +0.5, that pair isn’t doing diversification work — it’s just one bet in two wrappers. Drop the lower-conviction one and try again.
Step 4: Weight by conviction × stability
Once you have three or four truly uncorrelated positions, weight them by:
- Conviction — how confident are you in the strategy and the operator
- Yield stability — how much does the APY move around day to day (lower is more predictable income)
Don’t weight purely by current APY. A 5% APY that’s stable beats a 7% APY that swings between 2% and 14%, especially if you can’t time exits.
A 3-vault example
Using the data above, here’s a 3-vault portfolio that’s actually uncorrelated:
Compare that to a “naive” 3-vault portfolio: Steakhouse Prime + Gauntlet USDC Prime + Hyperithm USDC. Three Morpho vaults, three curators, three names. But their pairwise correlations are mostly positive and well above +0.5. That portfolio’s effective number of positions is closer to 1 than to 3. If anything moves the USDC borrow curve, all three move with it.
The first portfolio earns roughly the same blended APY. It just doesn’t all swing in the same direction.
Diversification in DeFi yield isn’t about how many logos you collect. It’s about whether your positions actually move independently.
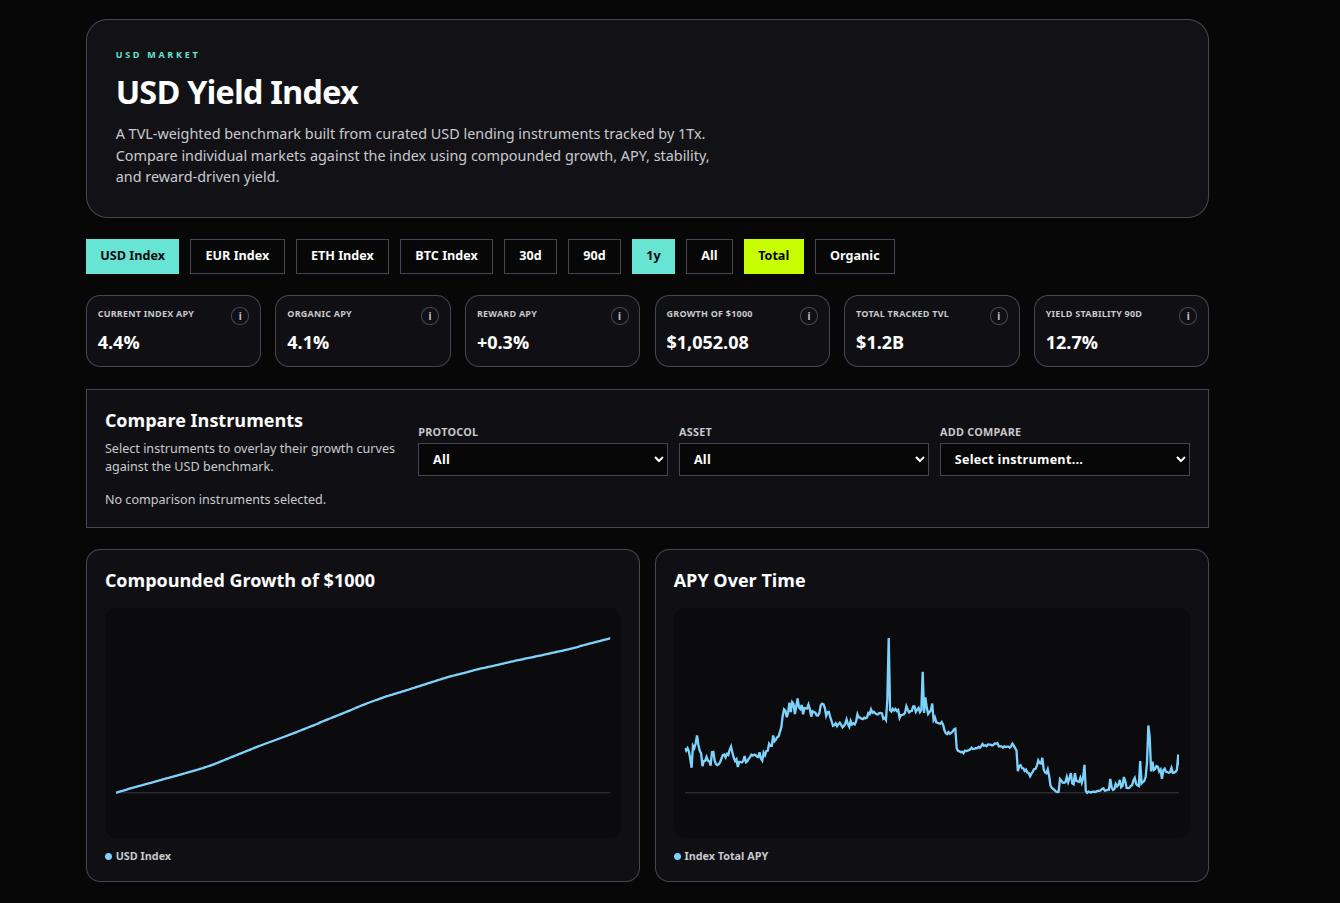
If you want to skip the spreadsheet work, I built a tool that runs this analysis automatically. Every instrument has a 90-day correlation column, a Diversifiers panel that surfaces the lowest-correlation candidates, and a one-click “add to comparison” that overlays their growth curves before you commit capital. The same data is exposed on a REST API if you’d rather build your own portfolio logic on top.
It’s at app.1tx.fi/markets — pick any instrument, scroll to the Diversifiers section, and the math is done for you.
The point isn’t the tool. The point is: most DeFi portfolios are one bet wearing five hats. Once you can see the correlation, you can’t unsee it.