The 2026 Strait of Hormuz Closure: A System Shock Analysis & Investment Playbook
The February 28, 2026 US/Israeli strikes on Iran and the subsequent IRGC blockade of the Strait of Hormuz represent a generational system shock — not merely an oil price event. Approximately 20 million barrels per day of hydrocarbon flow has been severed, forcing a violent rerouting of global trade, a repricing of maritime risk, and an accelerated energy transition. IMF models project a sustained disruption at $100/bbl would subtract 0.55pp from global GDP growth and add 1.2pp to inflation. The investment thesis is barbell-shaped: aggressively long Atlantic Basin E&P, US refiners, tanker operators, defense, and LNG exporters; tactically short Asian importers, European industrials, airlines, and rate-sensitive growth assets.
I. The Chokepoint Shock: Beyond the Oil Price Chart
Markets routinely treat oil spikes as one-dimensional events: prices jump, energy stocks rally, airlines sell off, and investors move on within weeks. The Hormuz blockade is categorically different. It is a chokepoint shock that simultaneously attacks physical energy flows, maritime logistics, industrial input costs, insurance markets, and monetary policy reaction functions.
On February 28, 2026, coordinated US and Israeli military strikes decimated Iran’s central military leadership. Within 48 hours, the Islamic Revolutionary Guard Corps (IRGC) enforced a complete blockade of the Strait of Hormuz — the world’s single most critical energy chokepoint. The numbers are staggering: approximately 14 million barrels per day (b/d) of crude oil, 4 million b/d of refined petroleum products, and one-fifth of global LNG supply were effectively sequestered overnight.
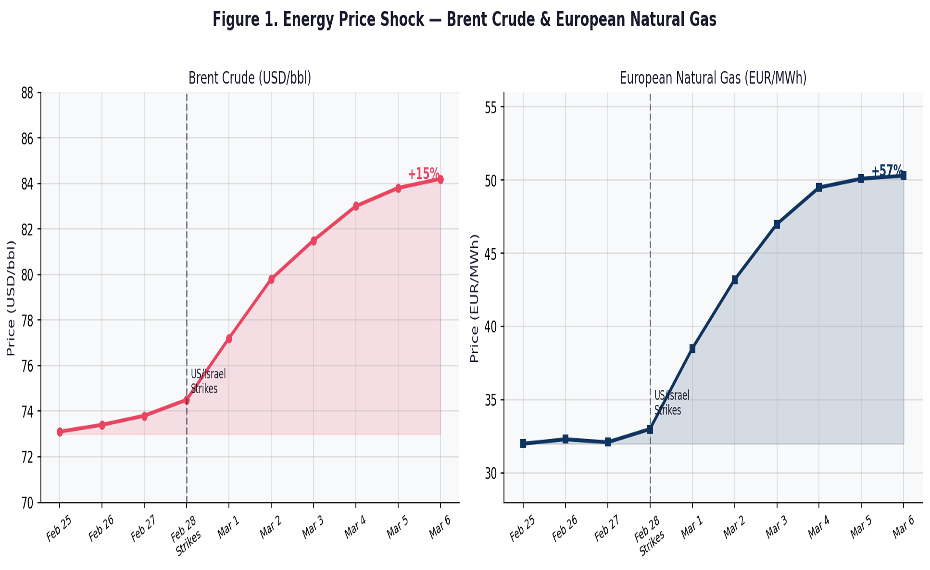
By March 2, only five oil tankers had successfully crossed the strait — down catastrophically from a daily average of 51 vessels recorded in February. Brent crude surged 15% to $84 per barrel within days. European natural gas prices exploded 55% to €50/MWh. VLCC tanker day-rates for the Middle East Gulf to Asia-Pacific route hit an all-time record of WS500 — a Worldscale figure that had never been touched in the market’s history.

II. Macro Transmission: Why the GDP Hit Is Larger Than the Oil-Weight Arithmetic
The Core Elasticity Framework
A common instinct is to multiply oil’s direct share of GDP by the percentage price increase. This accounting approach is directionally useful but materially underestimates the eventual macro damage. The IMF’s preferred framework uses a reduced-form elasticity estimate:
IMF Core GDP Formula
Δ Global GDP growth (pp) ≈ −0.15 × (Δ Oil Price % / 10) Interpretation: A 10% oil shock → −0.15pp to next-year global GDP and +0.4pp inflation. A 40% shock → −0.60pp GDP and +1.6pp inflation. These are elasticity estimates, not direct national-accounts share calculations.
With oil intensity of 0.43 barrel per $1,000 GDP, that gives:
- At $80 oil: 0.43×80=34.40.43×80=34.4, so direct oil spend is about $34.4 per $1,000 GDP, or about 3.4% of GDP.
- At $100 oil: 0.43×100=430.43×100=43, so direct oil spend is about $43 per $1,000 GDP, or about 4.3% of GDP.
The macro hit compounds through freight costs, chemicals and fertilizer input prices, consumer inflation expectations, central-bank rate path revisions, and corporate capex paralysis.
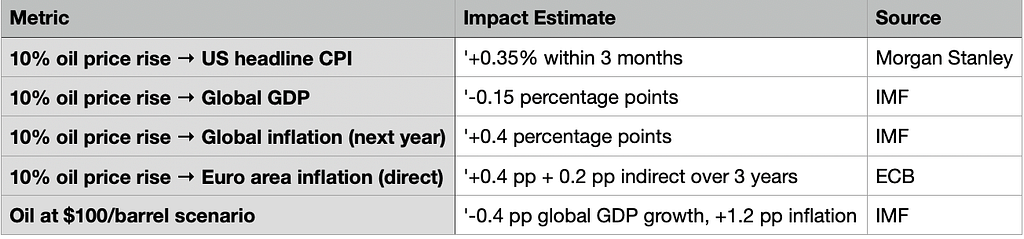
Morgan Stanley’s research adds granularity at the national level: a 10% oil price increase translates to approximately +0.35% on US headline CPI within three months. The ECB estimates the Euro area impact at +0.4pp direct and an additional +0.2pp indirect over three years.
Four-Scenario Stress Test
Figure 3. Scenario analysis: as Brent moves from the $73 baseline to a prolonged $150 crisis, the inflation impulse accelerates and the GDP drag becomes severely non-linear
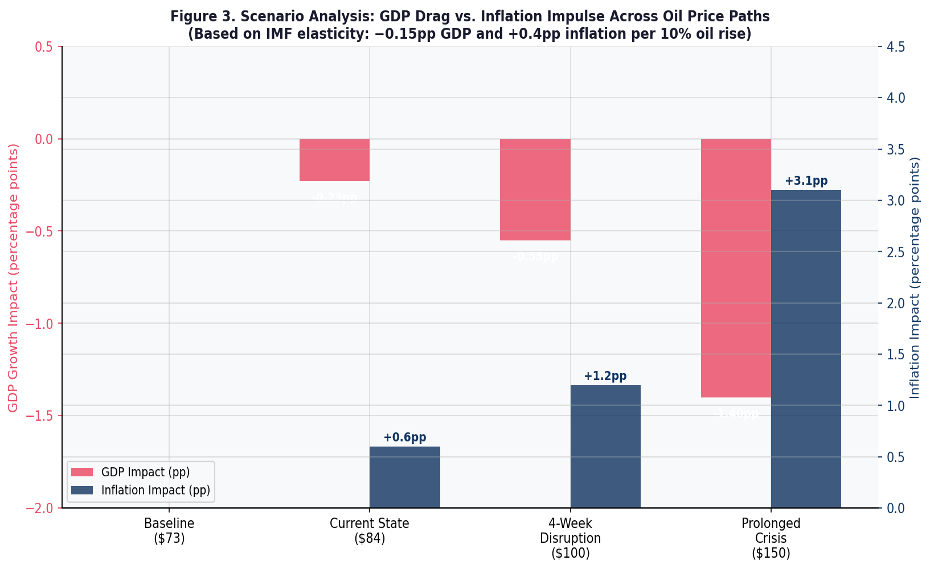
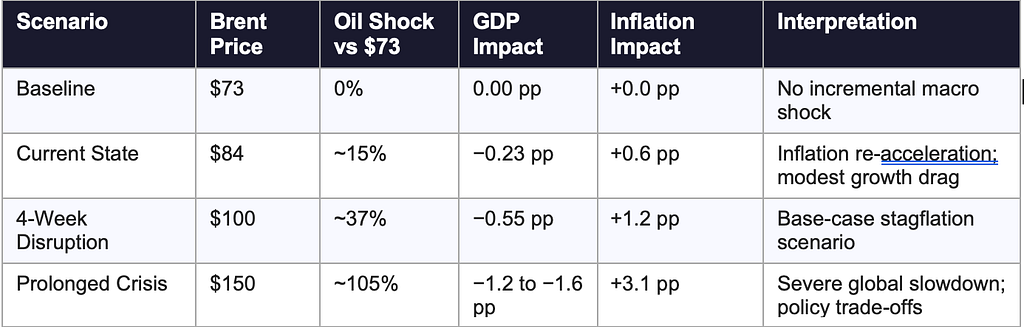
The prolonged-crisis row deserves special attention: once oil and gas shocks persist long enough to alter wage-setting behavior, corporate pricing plans, and rate-cut expectations, the simple linear elasticity rule begins to understate the damage through second and third-order feedback loops.
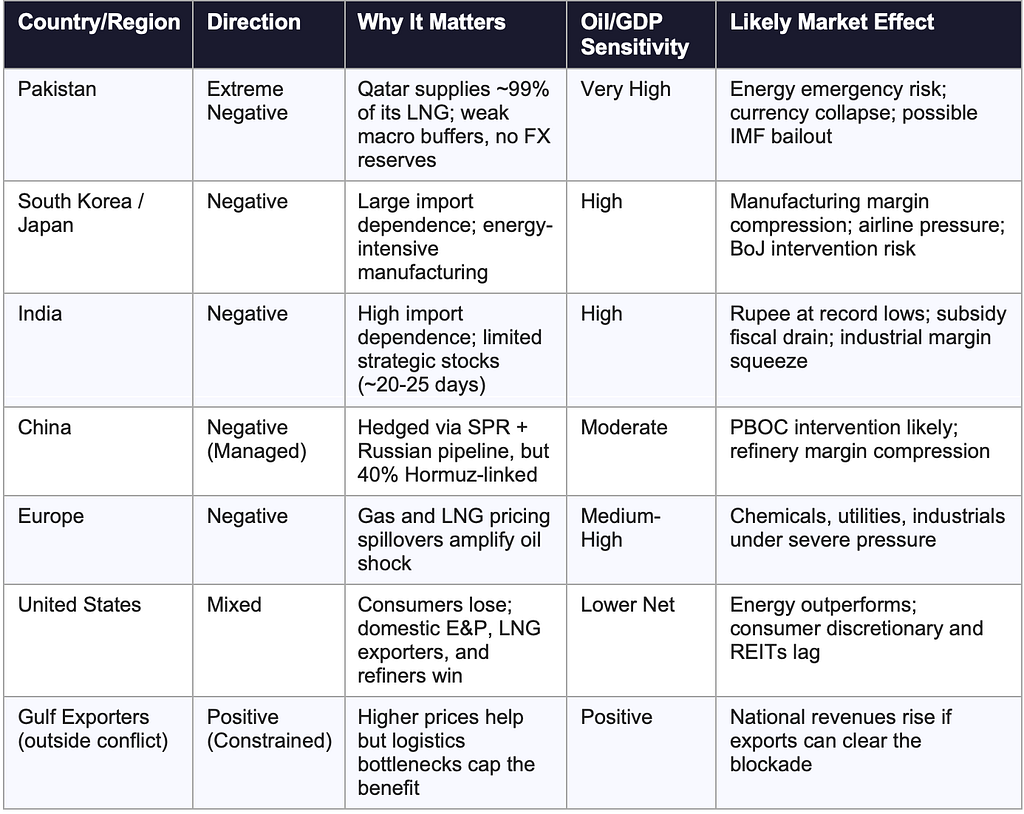
III. Asymmetric Country Exposure — Who Bleeds Most
Oil “weightage” is not symmetric across the global economy. The key analytical distinction is between net importers — who experience oil as an external tax on the current account, domestic inflation, and fiscal balance — and net exporters who experience the mirror-image benefit.

IV. The Freight Explosion & Maritime Insurance Collapse
The most underappreciated transmission channel is not the oil price — it is the freight and insurance market. When Hormuz closes, even physically available crude becomes economically unusable. Insurers cannot price the hull risk, charter availability evaporates, and delivery timing breaks down.
Major Protection & Indemnity (P&I) clubs have cancelled standard war risk coverage for the Middle East Gulf and Gulf of Oman. Additional War Risk Premiums have surged from a pre-war level of 0.15% to over 1% of vessel hull and machinery value. For a standard VLCC carrying 2 million barrels of oil, this translates to approximately $1.34 million in extra insurance costs per single transit — before counting the cargo value.

The economics of the disruption extend far beyond route closure. Vessels are trapped in the Middle East or forced onto significantly longer routes around the Cape of Good Hope. Total ton-mile demand for the global fleet has skyrocketed. LNG carrier day-rates for extended voyage routes have reached $280,000–$320,000 per day — a level that makes every available vessel a profit center and simultaneously strains cargo scheduling for every importer.
The US government, via the Development Finance Corporation (DFC), has announced plans to provide political risk insurance and US Navy escorts for maritime trade. However, the Lloyd’s Market Association has noted that shipowners remain deeply hesitant — physical crew safety concerns cannot be mitigated by financial indemnification alone.
V. The Supply Gap — Bypass Infrastructure Cannot Fill the Hole
With the maritime route compromised, global attention has shifted to overland pipeline bypass infrastructure. Saudi Arabia’s East-West crude pipeline (to the Red Sea port of Yanbu) and the UAE’s ADCOP pipeline (to Fujairah) offer a combined theoretical capacity of 3.5–7 mb/d. But this number is deeply misleading.
The East-West pipeline must also supply domestic Saudi refineries, consuming roughly 1 mb/d of capacity. Historical average loadings out of Yanbu have been only 1.4 mb/d. Iranian missile strikes have already struck the Fujairah terminal. The brutal arithmetic is this: no combination of available alternatives can materially replace the 20 mb/d that normally transits the strait.

VI. Nine Investment Themes for the New Energy Security Era
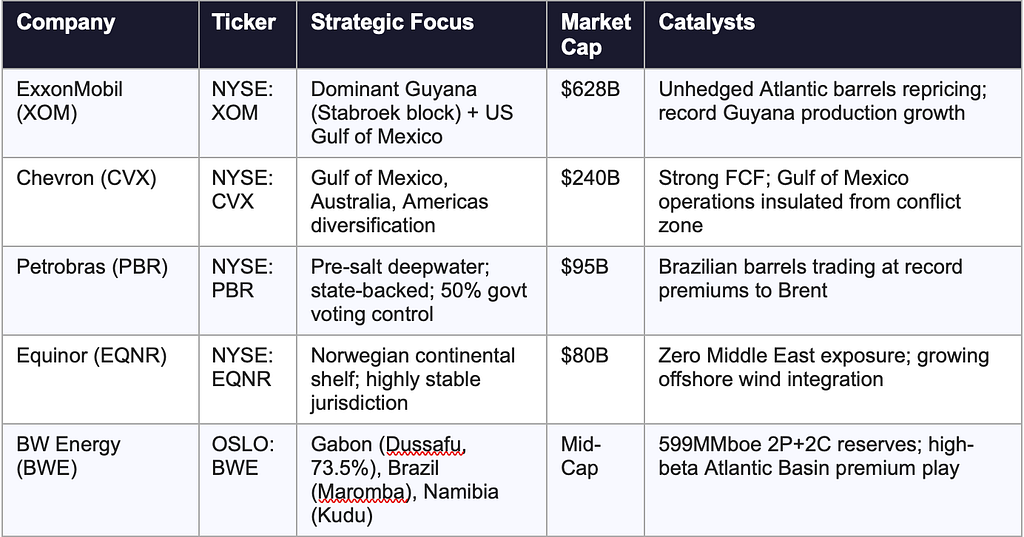
Theme 1 — Alternative Hydrocarbon Sourcing Supercycle
The geopolitical premium now permanently embedded in Middle Eastern crude is altering capital allocation globally. National security mandates dictate that the “Americas Quintet” — the United States, Argentina, Brazil, Canada, and Guyana — must accelerate production. Brazilian barrels for May 2026 delivery to China saw their premium to Brent nearly triple from $3.40 to $10/bbl in three days as Asian buyers aggressively bid for non-Gulf crude.
Theme 2 — Maritime Logistics & LNG Carrier Scarcity
Listed shipping companies with fleets operating outside the conflict zone or capable of commanding massive risk premiums for constrained-compliance markets are the clearest direct beneficiaries. Companies like Frontline and TORM, which saw substantial gains during prior compliance-market dislocations (Russia, Venezuela sanctions), are uniquely positioned to capture record freight rates. In LNG, the complete halt of Qatari exports forces Asian buyers to aggressively bid for US and Australian cargoes — massively benefiting Cheniere Energy ($52.5B market cap) and specialized LNG logistics firms.

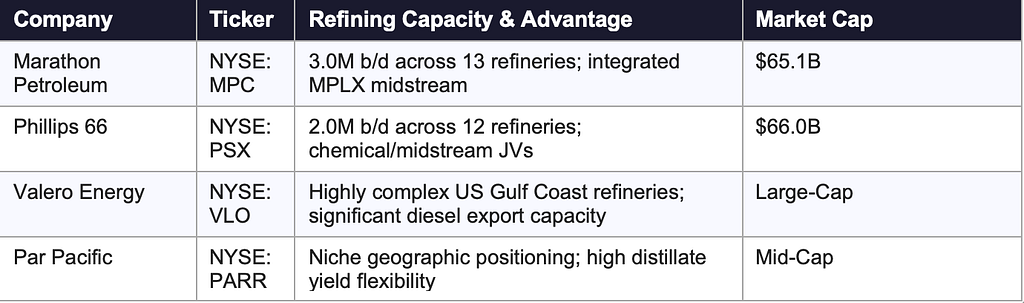
Theme 3 — Refining Margins & the Diesel Crack Spread Explosion
The more severe and immediate bottleneck lies not in crude pricing but in refined petroleum products. The “3–2–1 crack spread” — the gross margin from processing three barrels of crude into two barrels of gasoline and one barrel of diesel — has exploded as 4 mb/d of refined products normally transiting Hormuz, including one-fifth of Europe’s diesel, was severed. US Gulf Coast and ARA-hub refiners have become the suppliers of last resort for the global industrial economy.
Theme 4 — Defense Technology & Asymmetric Maritime Warfare
The crisis fundamentally alters the economics of maritime defense. A $50,000 Iranian drone can effectively paralyze a $100M VLCC cargo. This creates a severe economic asymmetry that makes conventional naval escorts prohibitively expensive and highlights the urgent need for autonomous Counter-UAS systems and private maritime security solutions. The US Navy’s Operation Earnest Will analogue cost ~$600M in 1987 dollars; the modern equivalent, facing hypersonic missiles, drone swarms, and autonomous underwater vehicles, is structurally more expensive and militarily more complex.

Theme 5 — Bypass Infrastructure & Midstream CapEx Supercycle
The severe inadequacy of existing bypass infrastructure will trigger a state-sponsored infrastructure spending boom across the Arabian Peninsula. Saudi Arabia’s Vision 2030 initiatives will rapidly accelerate cross-country pipeline construction, redundant storage terminal development, and advanced midstream network integration. EPC firms with deep ties to Saudi Aramco and ADNOC are positioned for multi-billion-dollar contracts. In the US, domestic midstream giants will benefit from the surge in domestic crude moving to export terminals.

Theme 6 — The Coal Renaissance & Utility Fuel Switching
Qatar Energy’s Ras Laffan complex is offline, removing 17% of global LNG exports. The asymmetric impact hits Asia hardest: Qatar supplied 30% of China’s LNG, 45% of India’s, and 99% of Pakistan’s in the prior year. With European gas storage low and Asian buyers sweeping the spot market, gas prices have decoupled from fundamental utility economics. European thermal coal indices have already surpassed $114.5/tonne — the highest since January 2025. Coal equities have gained ~28.8% vs. broad oil and gas’s 8.9% rally.

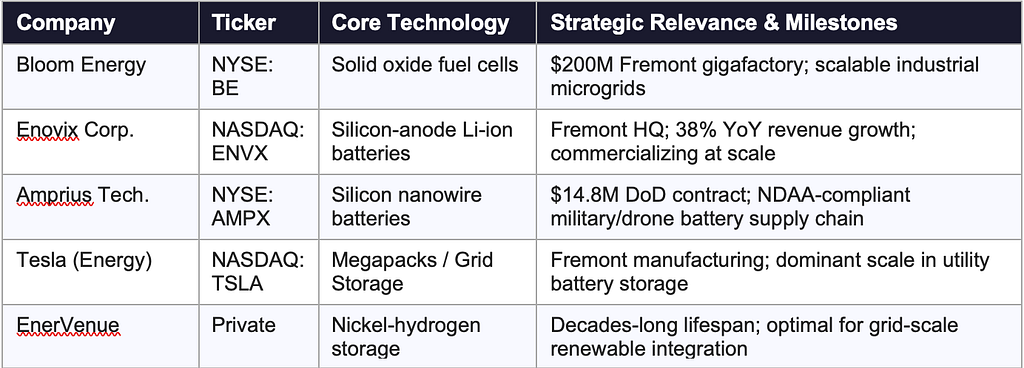
Theme 7 — Clean Energy Acceleration & Grid Resilience
The crisis is the ultimate, undeniable catalyst for the energy transition — no longer driven purely by ESG mandates but as an acute national security imperative. Advanced economies now recognize that localized renewable generation coupled with utility-scale battery storage is the only viable long-term defense against imported fossil fuel inflation. The geographic hub of this acceleration is concentrated in Fremont, California, which houses nearly 50 advanced battery and cleantech companies. California’s AB 2516 (Grid Manufacturing Initiative) and CPUC authorization of $2.8B in PG&E grid investment through 2026 reinforce this ecosystem.
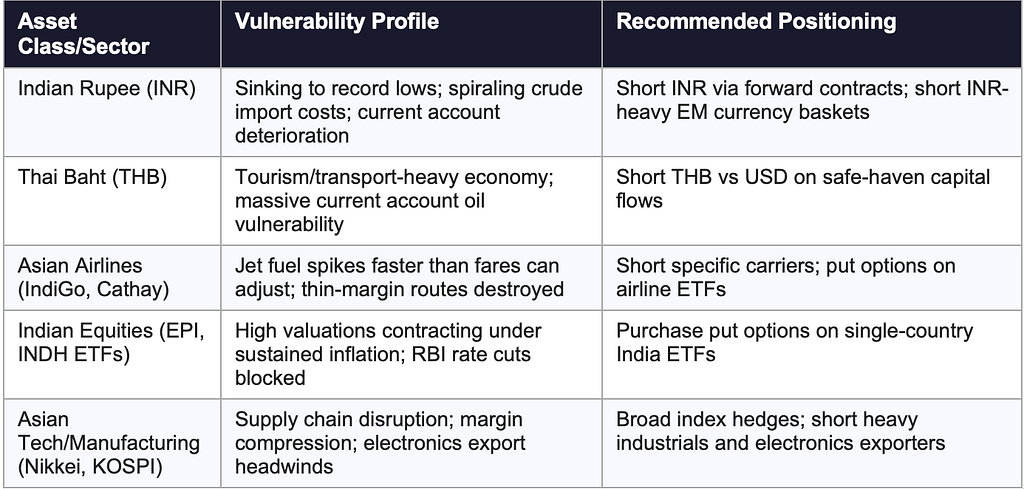
Theme 8 — Asian Macro Vulnerabilities & Targeted Short Strategies
The macroeconomic devastation falls disproportionately on emerging Asian economies. India spends ~3% of GDP on foreign oil with only 20–25 days of usable strategic stocks. Thailand spends ~5% of GDP on imported energy. In both cases, higher costs immediately translate into wider fiscal and current account deficits — governments are forced to subsidize retail prices or watch currencies collapse. The Indian Rupee has already fallen to record lows near 92.325 USD/INR. The KOSPI plunged 12%. The Nikkei saw severe percentage drops.
Theme 9 — US Domestic Policy, SPR, & Fed Rate Dynamics
The United States faces considerably less acute pain than European or Asian counterparts. US Henry Hub natural gas prices have risen only ~4% due to physical export capacity limits, insulating domestic manufacturing and utilities from the €50/MWh European chaos. As a net producer, higher oil prices push up domestic output and drive capital investment into the Permian Basin — acting as an economic stabilizer rather than a pure consumption tax.
However, the Fed faces a profound dilemma. A 10% crude increase translates to approximately 5% at the retail gasoline pump (Dallas Fed research). This immediately threatens to reverse CPI progress. Bond markets have already trimmed Fed rate-cut bets for 2026. The combination of a strong dollar (safe-haven flows) and higher-for-longer rates will exert immense pressure on global liquidity — exacerbating the capital flight from emerging Asian markets discussed in Theme 8. Meanwhile, the President holds a powerful finite tool: the 415-million-barrel Strategic Petroleum Reserve, with a nominal drawdown capability of 4.4 mb/day.
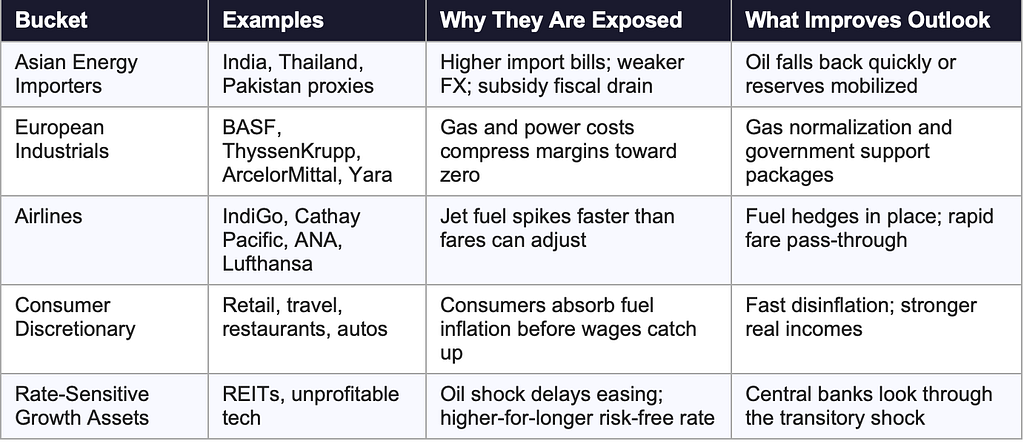
VII. Explicit Listed Winners & Losers
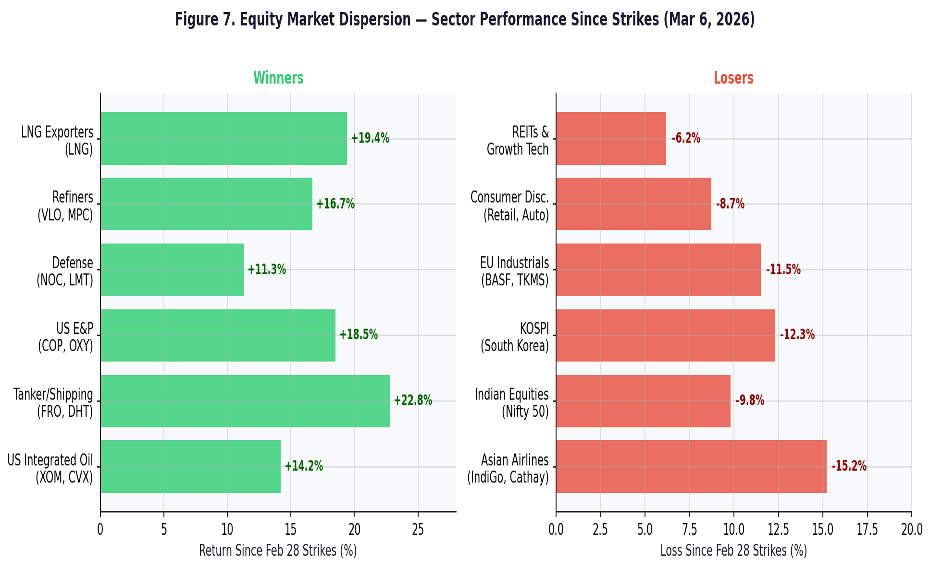
Beneficiary Buckets

Pressure Buckets
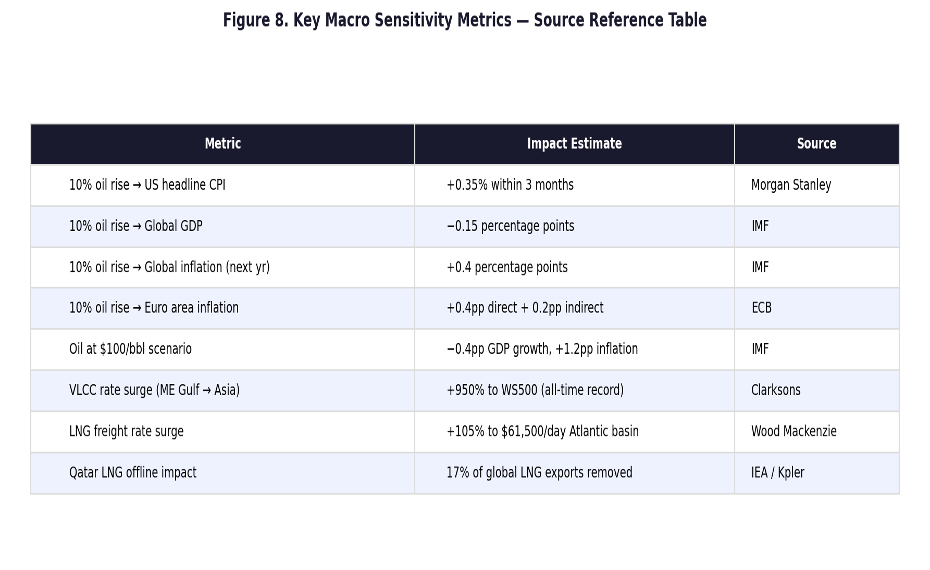
VIII. Key Macro Sensitivity Metrics — Source Reference
The table below consolidates the quantitative anchors underlying all scenario and equity analysis in this report. These figures are derived from IMF, ECB, Dallas Fed, Morgan Stanley, and industry data providers.
IX. Conclusion — The Barbell Portfolio for a New Energy Security Era
The most important analytical upgrade is to stop treating the Hormuz closure as a narrow commodity shock and to view it instead as a system shock to the global economic architecture. The direct oil spend share of GDP may be only 3–4%, but the realized growth drag becomes 2–3× larger because the disruption travels simultaneously through freight rates, industrial chemical costs, utility pricing, consumer confidence, inflation expectations, and central-bank reaction functions.
The 2026 closure transcends a typical geopolitical flare-up. It is a violent, systemic restructuring of global energy markets, maritime logistics, and macroeconomic equilibria. The analysis definitively indicates that capital will structurally flow out of vulnerable, energy-dependent emerging markets in Asia and into the sovereign assets and equities of the Americas and Northern Europe.
📊 The Barbell Portfolio Framework
LONG: Atlantic Basin E&P (XOM, CVX, PBR, EQNR) · US Refiners (MPC, VLO, PSX) · Tanker Operators (FRO, TRMD) · LNG Exporters (LNG) · Defense Tech (NOC, RTX, LMT, PLTR) · Clean Energy & Storage (BE, TSLA Energy) · EPC Infrastructure (L&T, EPD) · Coal Exporters (BTU, ARLP, CEIX) SHORT: Asian Import-Dependent Currencies (INR, THB) · Asian Airlines · Indian/Korean Equity Indices · European Industrials (BASF, ArcelorMittal) · Consumer Discretionary · REITs & Unprofitable Tech
If the disruption proves brief — a ceasefire within weeks — this remains a sharp tactical event with fast mean-reversion in the longs and shorts. If it persists beyond four weeks, it becomes a broader macro re-pricing in which energy security, logistics resilience, domestic production capacity, and pricing power matter more than traditional growth narratives for the remainder of the decade.
GEOPOLITICAL ENERGY CRISIS was originally published in DataDrivenInvestor on Medium, where people are continuing the conversation by highlighting and responding to this story.