In the modern Windows security landscape, certain processes have more protection than others based on its citicality. Such processes are called “protected”, like lsass.exe or third-party anti-malware services. In spite of having any level of privileges and access, one can not attach a debugger to such a process in user mode. This protection is the result of Protected Processes (PP) and Protected Process Light (PPL), security mechanisms designed to prevent unauthorised tampering, code injection and termination of sensitive system components and critical process by lower privileged code.
In this article, I examined the architecture of Windows Protected Process, the challenges they pose for developers and security researchers, and the techniques used to debug them.
Purpose of PPL Process
- Protect core system process and security product process from being manipulated or killed( Debugging, Shutdown, and Changing of memory working set)
- Prevent credential theft
- Block access to virtual memory
- Prevent changing and receiving information about the current state of the thread
- Prevent impersonation of threads (running process threads under a different account)
The Evolution of Protected Process
The concept of a Protected Process was first introduced in Windows Vista to support Digital Rights Management (DRM) . At that time, it was like binary state: a process was either protected or it wasn’t. However, this model was too rigid for the broader ecosystem of security software.
From PP to PPL
With the release of Windows 8.1, Microsoft introduced Protected Process Light (PPL). This evolution allowed for a more granular approach to protection, enabling non-Microsoft security software to run with elevated protection levels while still maintaining a hierarchy of trust.

Singer and Protection level are the main component of protected process which is part of PS_PROTECTION structure.
The PS_PROTECTION Structure
At the heart of this mechanism is the PS_PROTECTION structure, which is stored within the kernel’s EPROCESS object for every running process. This structure is a single byte that defines both the Protection Type and the Signer .
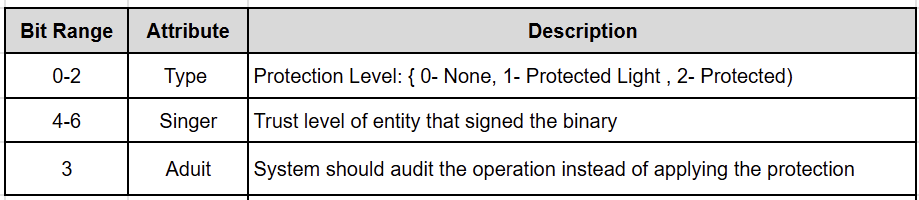

The hierarchy is strictly enforced: a process can only open another process if its own protection level is equal to or higher than the target’s, and its signer level is compatible. For example, a PsProtectedSignerWinTcb process can access almost anything, while a PsProtectedSignerAntimalware process is restricted to its own level and below.
Steps of making any process a PPL involves
- Sign process executable with Microsoft issued code signing certificate that includes the Enhanced Key Usage right
- Registered ELAM driver having the hash of certificate used for signing the user mode binary
- The binary should be page hash signed
The protected service launch is orchestrated by the Service Control Manager (SCM) [8].
Why You Can’t Just Attach a Debugger
Under normal circumstances, a user with SeDebugPrivilege can attach a debugger to any process.
Windows kernel explicitly blocks OpenProcess requests to protected processes unless the requesting process is also protected at a sufficient level.
The kernel returns an ACCESS_DENIED error on any attempt to attach a user-mode debugger to a PPL process. This is because the debugger, running as a standard (unprotected) process, lacks the necessary “Signer” and “Type” attributes in its EPROCESS structure to interact with the protected target.
Techniques to Debug Protected Processes
Despite these protections, there are several ways to bypass or work within the PPL framework for legitimate research and debugging purposes. The debugging technique involves either downgrading the target or elevating the debugger.
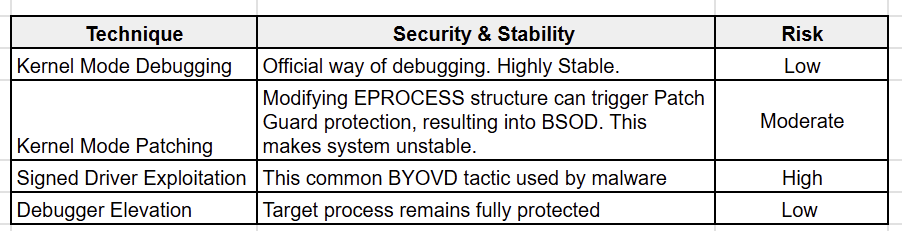
Technique 1: The “Official” Way — Kernel-Mode Debugging
The most stable and supported method is to use a kernel-mode debugger. This typically requires two machines (or two virtual machines) connected via a virtual serial port, network, or USB debug cable .
- Break into the Kernel: Use WinDbg on the host machine to break into the target system’s kernel.
- Switch Context: Use the .process /i /p <EPROCESS_Address> command to switch the debugger’s context to the target process.
- Set User-Mode Breakpoints: Once in the correct process context, you can set breakpoints on user-mode addresses. The kernel debugger will handle the transition between kernel and user space.
This is highly effective because the kernel debugger operates “above” the PPL enforcement mechanism, which only applies to user-mode access requests.
Technique 2: Patching the Kernel in Memory
If you prefer user-mode debugger, manually downgrade the target process’s protection level.
Warning: Modifying kernel structures directly can trigger PatchGuard (Kernel Patch Protection), leading to a Blue Screen of Death (BSOD) if the system detects the change.
Locate the EPROCESS structure of the target process in WinDbg, and find the Protection byte (often at offset 0x87a or 0x5b2 depending on the Windows version) and set it to 0x00. Once patched, the process is no longer “protected,” and you can attach any standard user-mode debugger.
I am taking example of Microsoft Malware Protection Engine(MsMpEng.exe), core executable of Windows Defender. I located the process using !dml_proc. On my dev vm
0: kd> !process 0xffffe689700aa080 0
PROCESS ffffe689700aa080
    SessionId: 0  Cid: 16c8    Peb: 7aa7d65000  ParentCid: 0458
    DirBase: 139f4000  ObjectTable: ffff98072bdf6480  HandleCount: 900.
    Image: MsMpEng.exe

0: kd> dt _EPROCESS ffffe689700aa080 Protection
nt!_EPROCESS
   +0x87a Protection : _PS_PROTECTION
0: kd> dx -id 0,0,ffffe689688e3040 -r1 (*((ntkrnlmp!_PS_PROTECTION *)0xffffe689700aa8fa))
(*((ntkrnlmp!_PS_PROTECTION *)0xffffe689700aa8fa))                 [Type: _PS_PROTECTION]
    [+0x000] Level            : 0x31 [Type: unsigned char]
    [+0x000 ( 2: 0)] Type             : 0x1 [Type: unsigned char]
    [+0x000 ( 3: 3)] Audit            : 0x0 [Type: unsigned char]
    [+0x000 ( 7: 4)] Signer           : 0x3 [Type: unsigned char]

After confirming the protection bit of process, lets try resetting it via kernel debug
0: kd> dx -r1 @$cursession.Processes.Where(p => p.Name == "MsMpEng").Select(p => p.KernelObject->Protection.Type = 0)
Now check the protection statue of MsMpEng.exe
0: kd> dx -id 0,0,ffffe689688e3040 -r1 (*((ntkrnlmp!_PS_PROTECTION *)0xffffe689700aa8fa))
(*((ntkrnlmp!_PS_PROTECTION *)0xffffe689700aa8fa))                 [Type: _PS_PROTECTION]
    [+0x000] Level            : 0x30 [Type: unsigned char]
    [+0x000 ( 2: 0)] Type             : 0x0 [Type: unsigned char]
    [+0x000 ( 3: 3)] Audit            : 0x0 [Type: unsigned char]
    [+0x000 ( 7: 4)] Signer           : 0x3 [Type: unsigned char]
The protection flag can also be cleared through eb cmd
0: kd> eb 0xffffe689700aa8fa  0
0: kd> db 0xffffe689700aa8fa l2
0xffffe689`700aa8fa  00 00
This is my favourite and a popular technique used for debugging the PPL process. You may need to disable the protection again if the process restarts during debugging for any reason.
Technique 3: Leveraging Signed Drivers (PPLKiller & PPLcontrol)
Security researchers often use tools like PPLKiller or PPLcontrol to automate the patching process without a full kernel debugging setup. These tools leverage legitimate, signed drivers that contain “Read/Write primitives” — functions that allow a user-mode application to read from or write to arbitrary kernel memory .
1.Install the Driver: The tool loads a signed driver (e.g., an MSI motherboard utility driver).
2.Locate EPROCESS: The tool uses the driver’s read primitive to traverse the kernel’s process list and find the target’s EPROCESS structure.
3.Apply the Patch: It uses the write primitive to zero out the Protection byte.
While powerful, this technique is risky. Using “vulnerable-by-design” drivers is a common tactic for both researchers and malware authors, and Microsoft frequently revokes the signatures of drivers known to be abused in this way.
Technique 4: Protecting the Debugger
A more elegant approach is to “upgrade” the debugger rather than “downgrading” the target. By using a kernel driver to set the Protection byte of your debugger’s own EPROCESS structure to a high level (e.g., PsProtectedSignerWinTcb), the debugger gains the authority to open and debug any other protected process on the system .
This method is often preferred because it minimizes the impact on the target process’s behavior and is less likely to trigger stability issues compared to stripping protection from a critical system service.
This approach requires signing windbg.exe( may also need to sign other windbg dll dbgeng.dll, dbghelp.dll and dbgmodel.dll) with ppl certificate. While signing the windbg and its dll, make sure to copy the original one somewhere as backup.
The article outlines four techniques for debugging Windows Protected Processes (PP/PPL), ranging from standard administrative procedures to advanced kernel manipulations:
Key Security Considerations
- PatchGuard (KPP): Any technique that modifies kernel structures (like Technique 2 and 3) runs the risk of triggering Windows Kernel Patch Protection. If detected, the system will immediately crash to prevent further corruption.
- System Integrity: Techniques that permanently strip protection from a process (like LSASS) leave that process vulnerable to credential dumping or tampering by other malicious software running on the system.
- Forensic Footprint: Using signed drivers (Technique 3) leaves a significant forensic trail. Security software often monitors for the loading of known vulnerable drivers, making this technique easy to detect in a monitored environment.
Conclusion
Windows Protected Processes represent a significant hurdle in the pursuit of system transparency and security research. By moving the enforcement of process boundaries into the kernel and tying them to cryptographic signatures, Microsoft has created a robust defense against many common forms of process tampering.
However, as we have seen, the “un-debuggable” is often just a kernel-patch away. Whether through the official channel of kernel-mode debugging or the more aggressive tactics of memory patching and driver exploitation, understanding these techniques is essential for any advanced Windows developer or security professional.
References
[1] Windows PPL (Protected Processes Light) | by S12
[2] The Evolution of Protected Processes Part 1
[3] “Unlocking Windows Protected Processes: A Deep Dive into PPL and Signer Levels” — Medium
[4] Debugging Protected Processes | itm4n’s blog
[5] Get Started — Windows Debugger WinDbg, Kernel-Mode
[6] Windbg Cookbook: Attach to a PPL Process from UM
[7] itm4n/PPLcontrol: Controlling Windows PP(L)s — GitHub
[8] Protecting-anti-malware-services
Debugging Windows Protected Processes : Practical Techniques & Internals was originally published in Level Up Coding on Medium, where people are continuing the conversation by highlighting and responding to this story.